Medical Imaging and Detector R&D
Our group is involved in the research and development of novel medical imaging devices, particularly Positron Emission Tomography (PET) scanners. As a member of the TOF-PET for Proton Therapy (TPPT) collaboration, we are assisting in the construction of a prototype PET scanner for use in proton therapy at MD Anderson Cancer Center. Additionally, we are developing simulations and empirically testing various new PET scanner geometries that may provide significantly improved sensitivity relative to current clinical PET scanners.
About Positron Emission Tomography (PET)
Positron emission tomography (PET) is a powerful, noninvasive tool for molecular imaging of metabolic processes, used, e.g., for identifying tumors or brain disease. Fig. 1 illustrates how PET works; its labelled components are detailed below. The underlying principle of PET is the coincident detection of gamma rays (labelled ②) emitted in opposite directions from positron annihilation, which occurs at site ① after a tracer molecule injected into the bloodstream of a patient undergoes decay. A PET scanner itself consists of rings of scintillator crystals ③ coupled to photodetectors ④. The gamma rays interact in the crystals to produce showers of optical photons, and these photons trigger an electric signal when they strike the photodetectors. A coincidence event occurs when two photodetectors trigger at almost exactly the same time, indicating that an annihilation occurred along the line connecting the photodetectors. Modern scanners use time-of-flight (TOF) corrections to localize the annihilation site along this line. That is, if one photodetector triggers a time before the other, the annihilation site should be a distance closer to the first photodetector than the second, with the speed of light. However, there is variance in the difference between the time at which a gamma ray enters a crystal and the time at which this gamma ray causes a trigger, largely because this difference depends on the depth at which the gamma ray interacts in the crystal, called the DOI. Therefore, there is uncertainty in the position of the annihilation site. Within a certain degree of confidence, one can only restrict the annihilation site to a line segment ⑤.
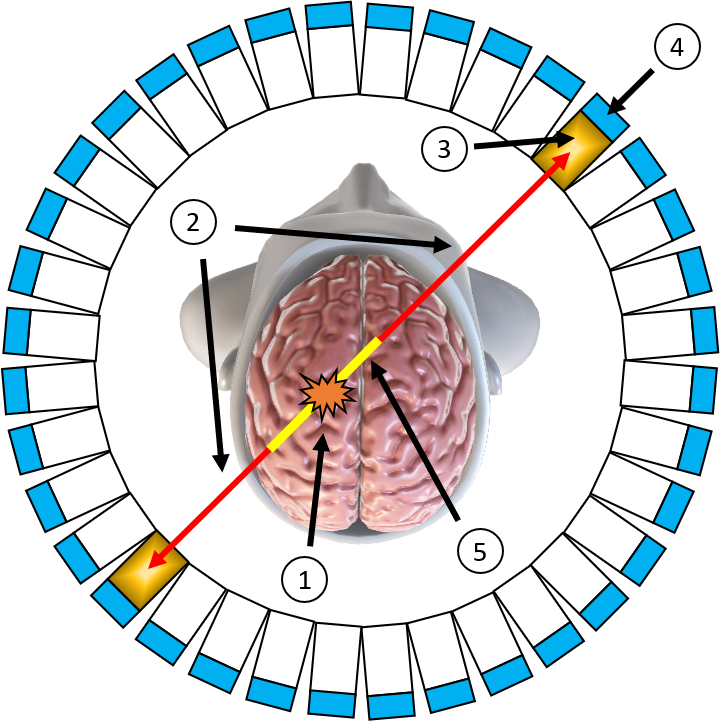
Figure 1: Schematic diagram of a PET scanner.
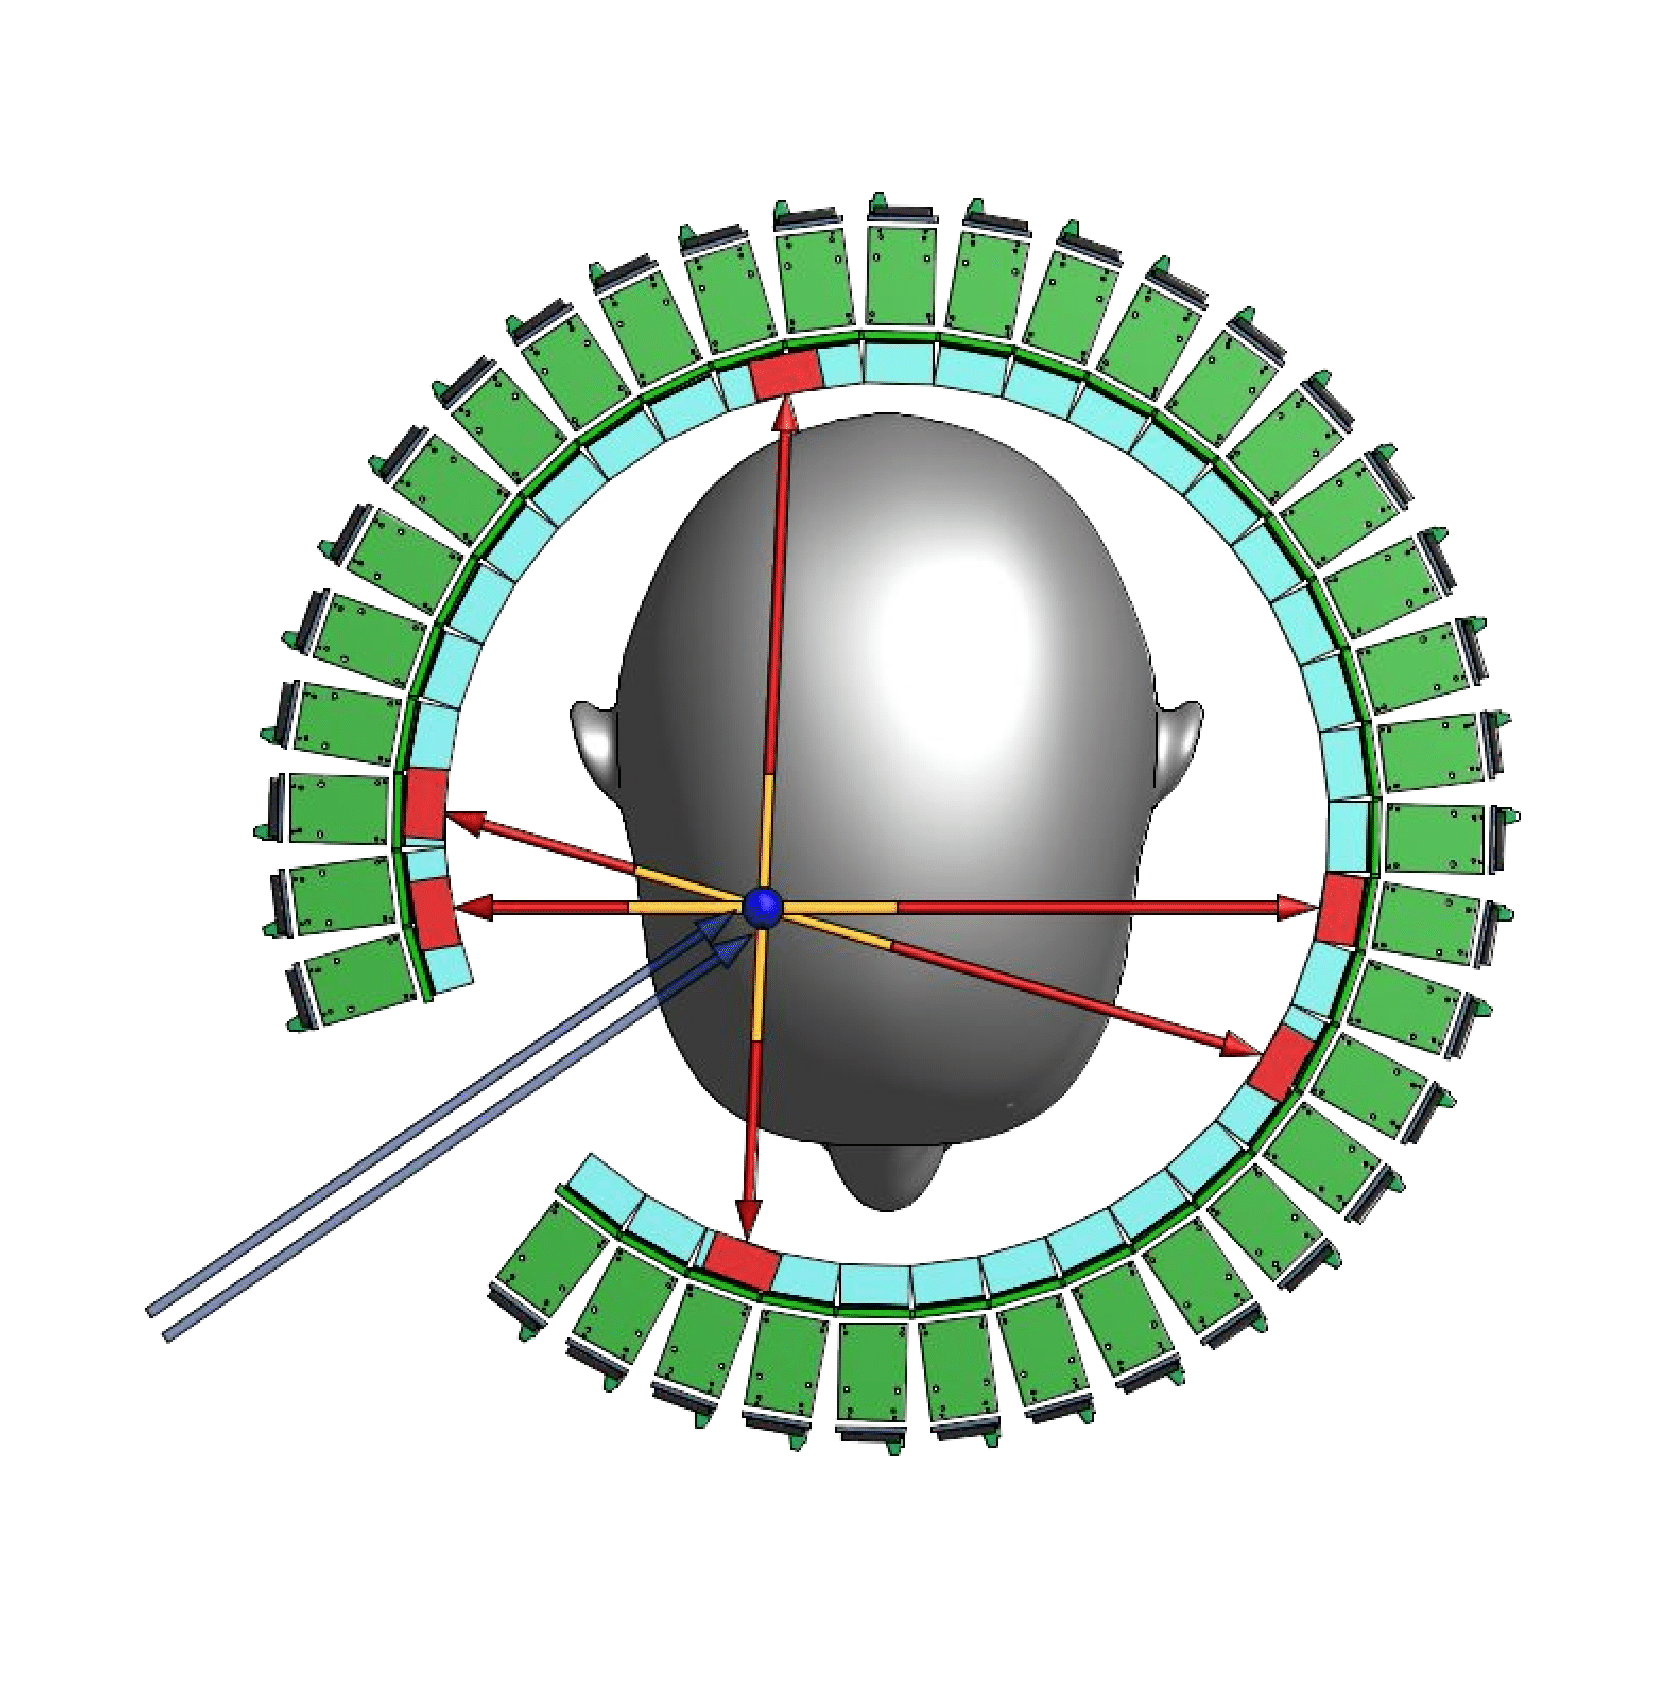
Figure 2: Schematic Diagram of Proton Therapy, in which the blue arrows are the proton beam.
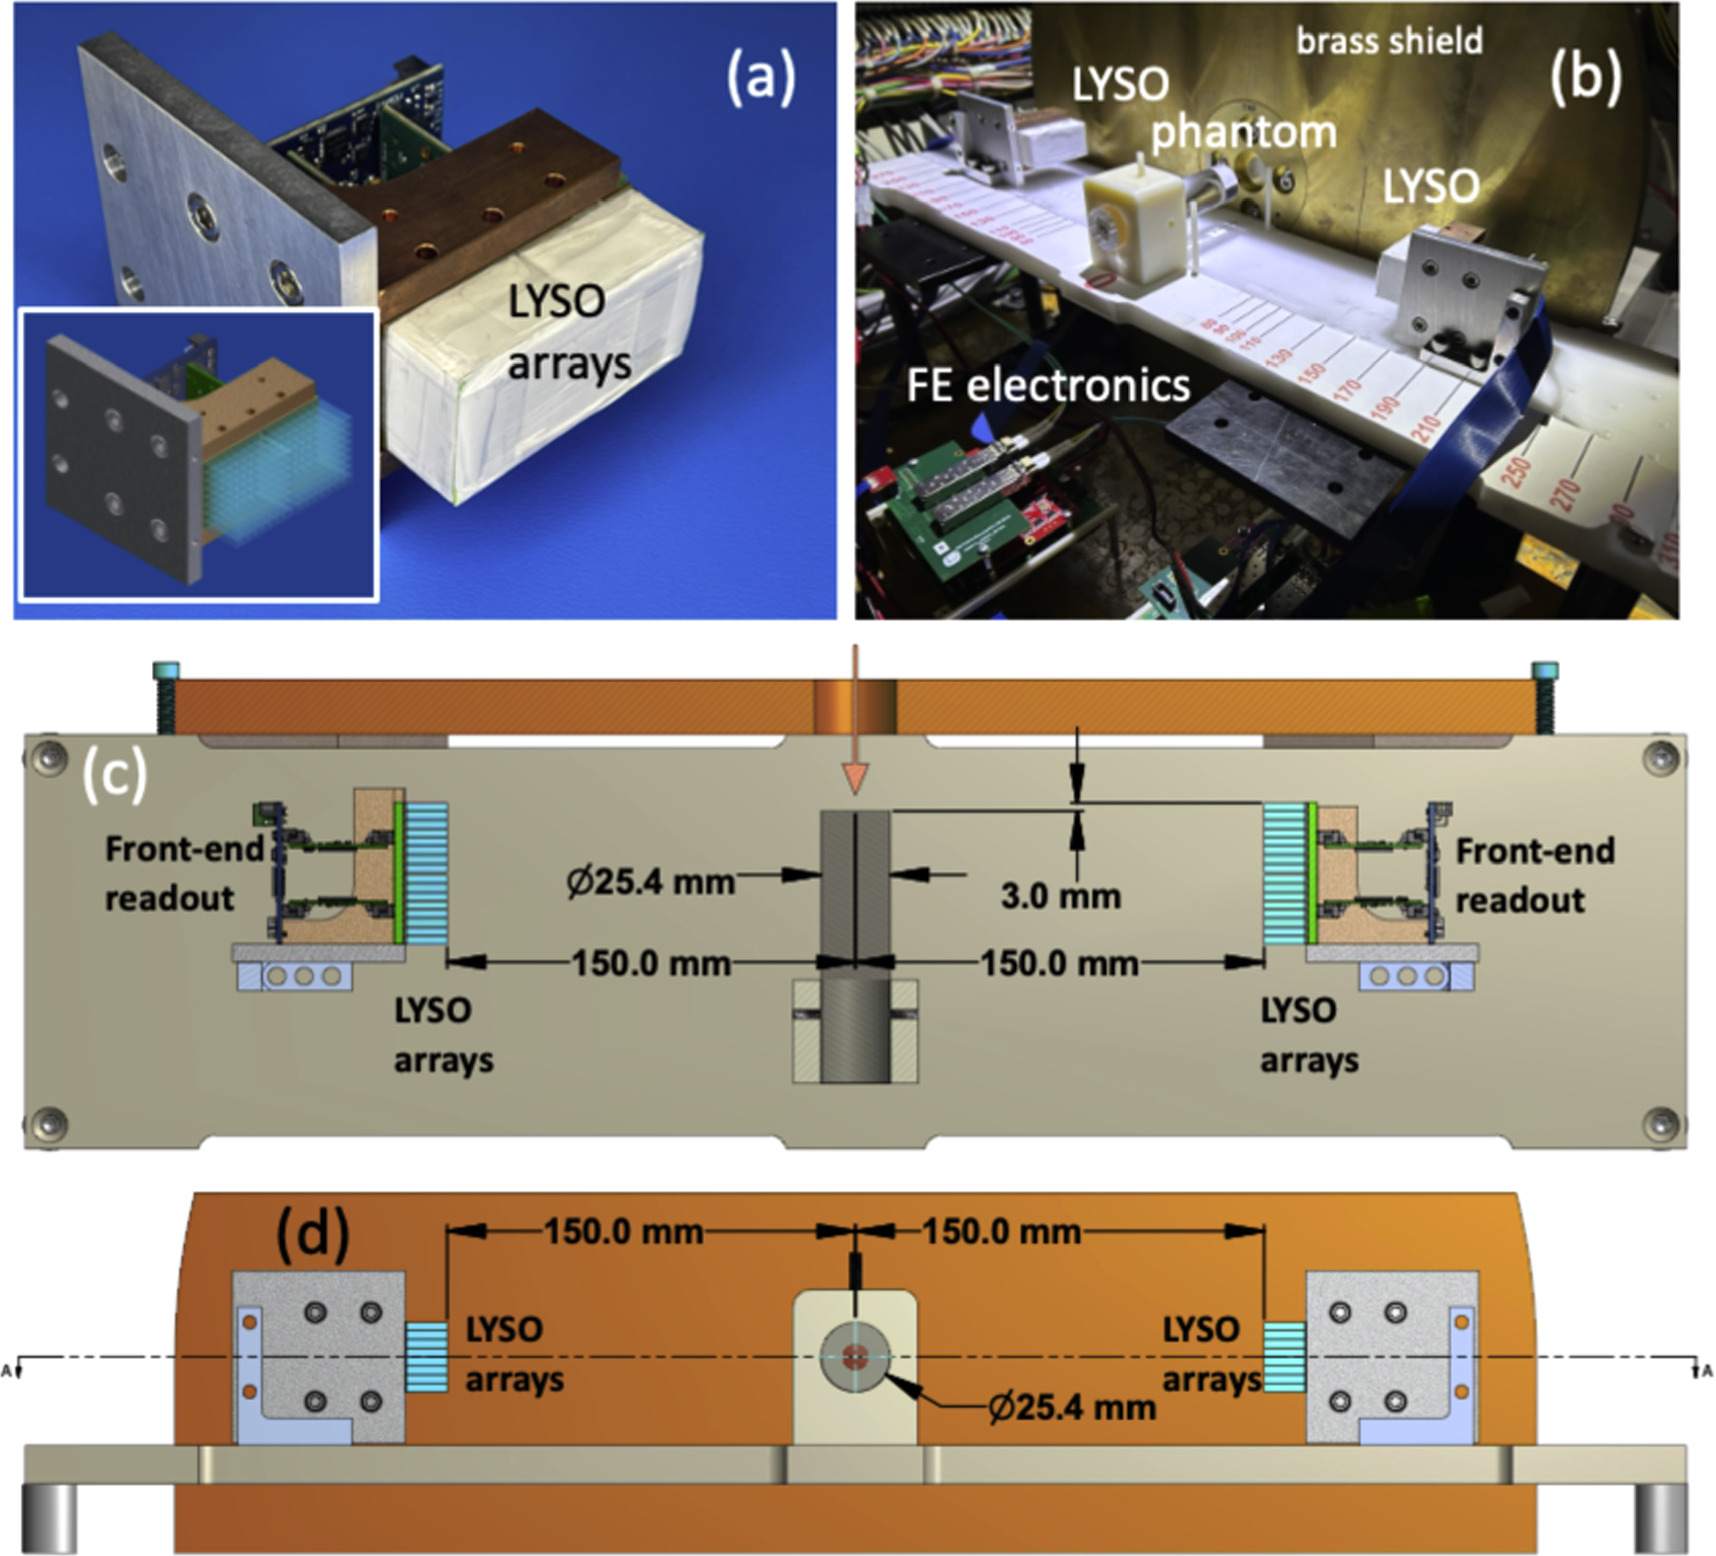
Figure 3: A setup of a mini-PET scannar (a) A PET module comprised of 2 × 64 scintillating LYSO crystal arrays as schematically shown in the inset. (b) A photograph of a complete setup and a PMMA phantom installed in the beam. (c) and (d) Schematic views from above and looking upstream, respectively, of a complete setup at one of the exposure configurations. The beam direction is indicated by an orange arrow.
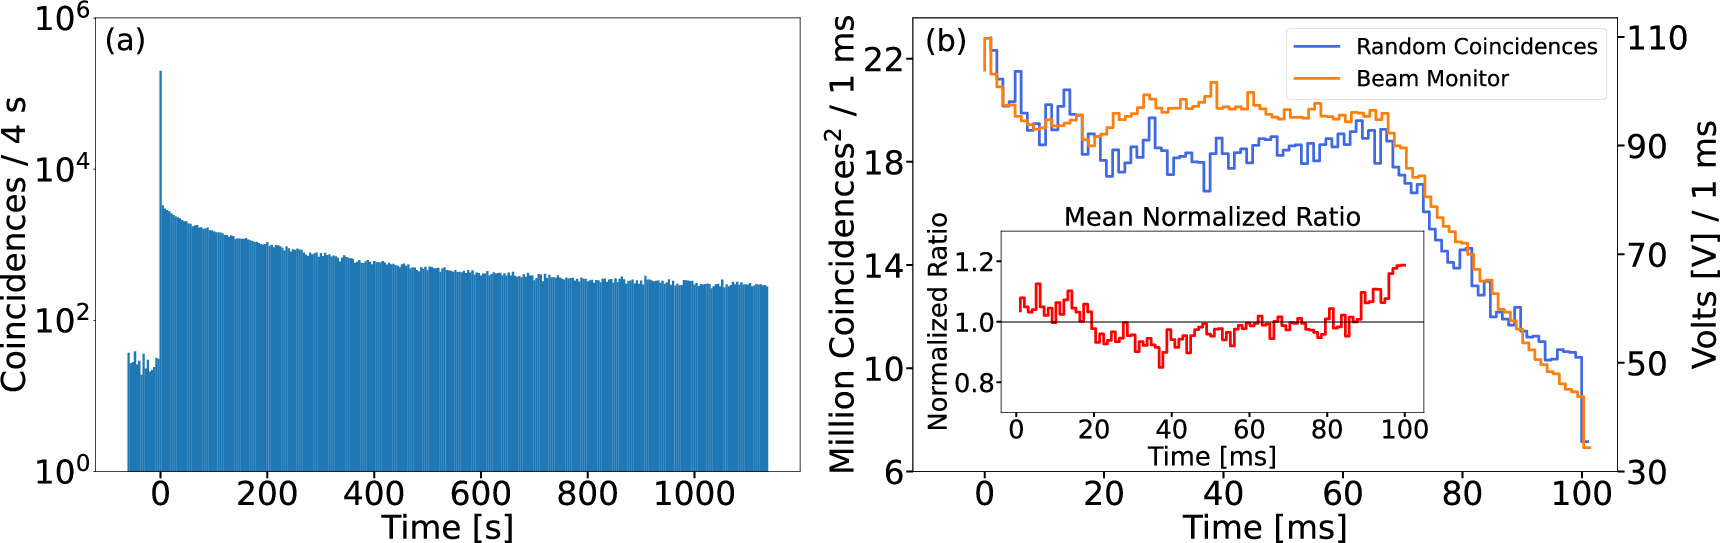
Figure 4: A typical time spectrum of (a) the number of PET coincidences as a function of time across a 20 min data acquisition period for PMMA 2 phantom at a separation distance of 210 mm. The spill occurred at approximately the 62 s mark. The activity shown before the spill arises from the background radiation environment induced from prior spills. (b) A comparison between PET random single coincidences to the beam monitor output voltage per 1 ms. The mean normalized ratio between the two quantities as a function of time is displayed in the inset.
TOF-PET for Proton Therapy (TPPT)
Our group is a member of the In-beam Time-of-Flight (TOF) Positron Emission Tomography (PET) for proton radiation therapy (TPPT) collaboration, which has been commissioned to design and construct a prototype PET scanner with high time resolution for use in proton therapy at MD Anderson Cancer Center. The proton therapy used in cancer therapy produces short-lived positron emitting radioisotopes, such as 15 O, 13 N and 11 C, which can be detected by a PET scanner. Such detection would allow for unprecedented proton beam accuracy and, therefore, safer and more effective cancer treatment. However, the geometric constraints of the proton beam itself require such a PET scanner to have only partial solid angle coverage. To make up for this partial coverage, the scanner must have excellent time resolution. Fig. 5 shows the design created for the TPPT collaboration to match these criteria, which we will assist in constructing. More information about the collaboration may be found here: https://utaustinportugal.org/projects/tppt/.
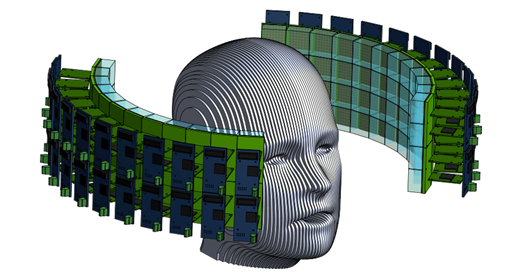
Figure 5: PET scanner design for the TPPT collaboration.
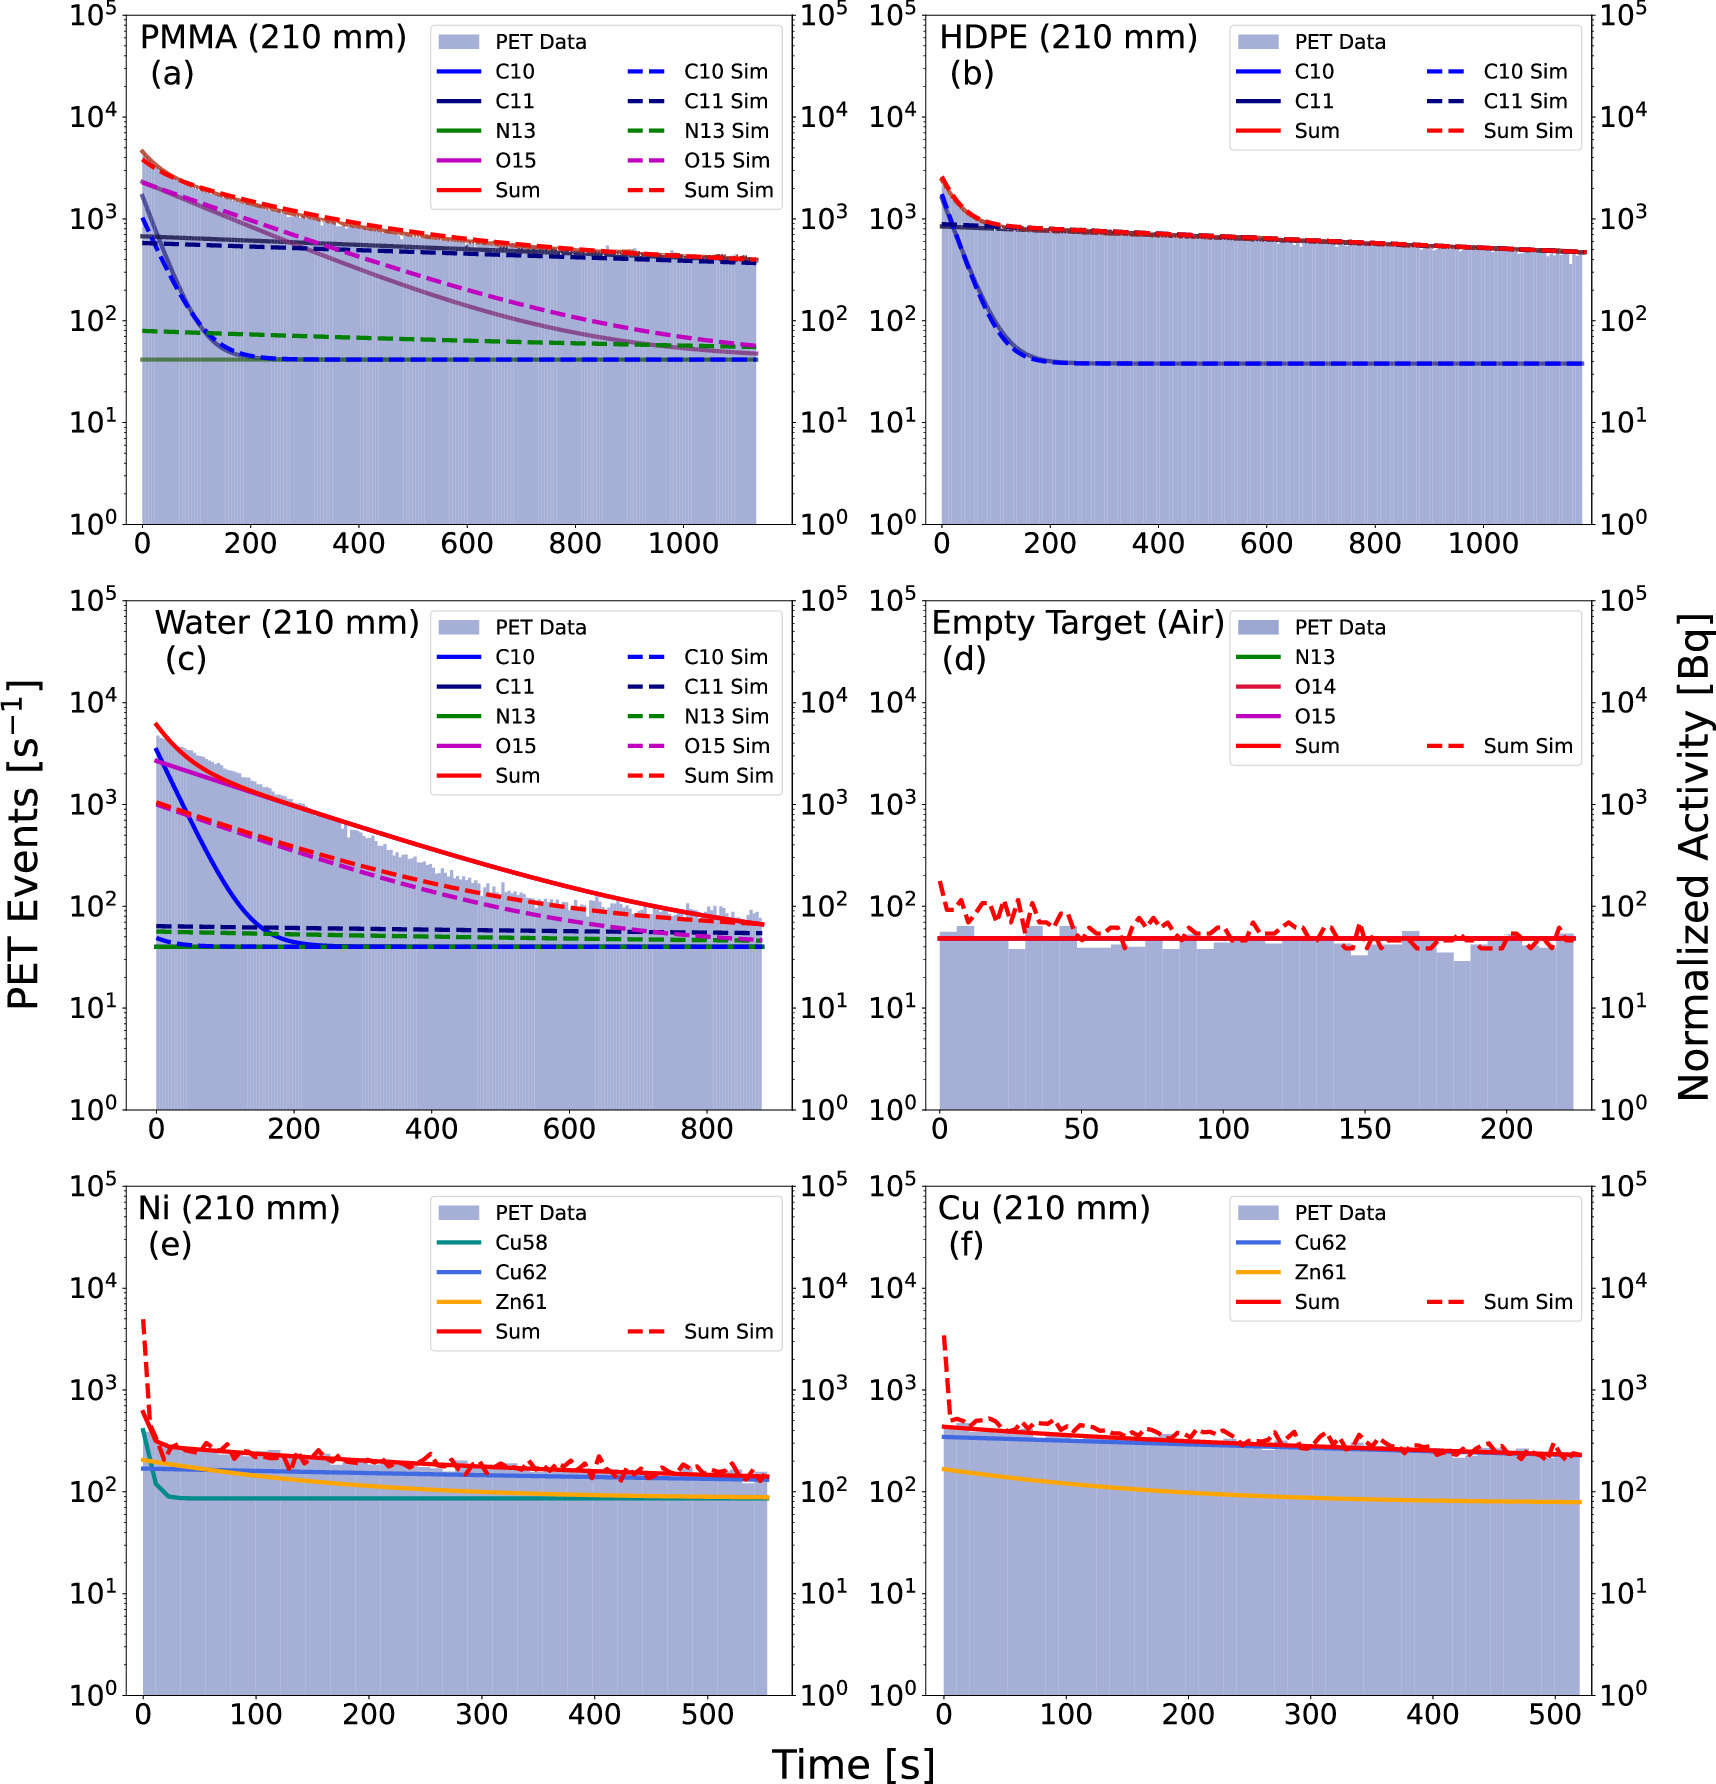
Figure 6: Post-spill PET coincidence data and fits as a function of time for phantom runs with the PET modules placed at 210 mm from the beam center line. Data are shown as a filled blue histogram, fits are marked by solid lines, while results of Geant4 simulations are shown with dashed lines.
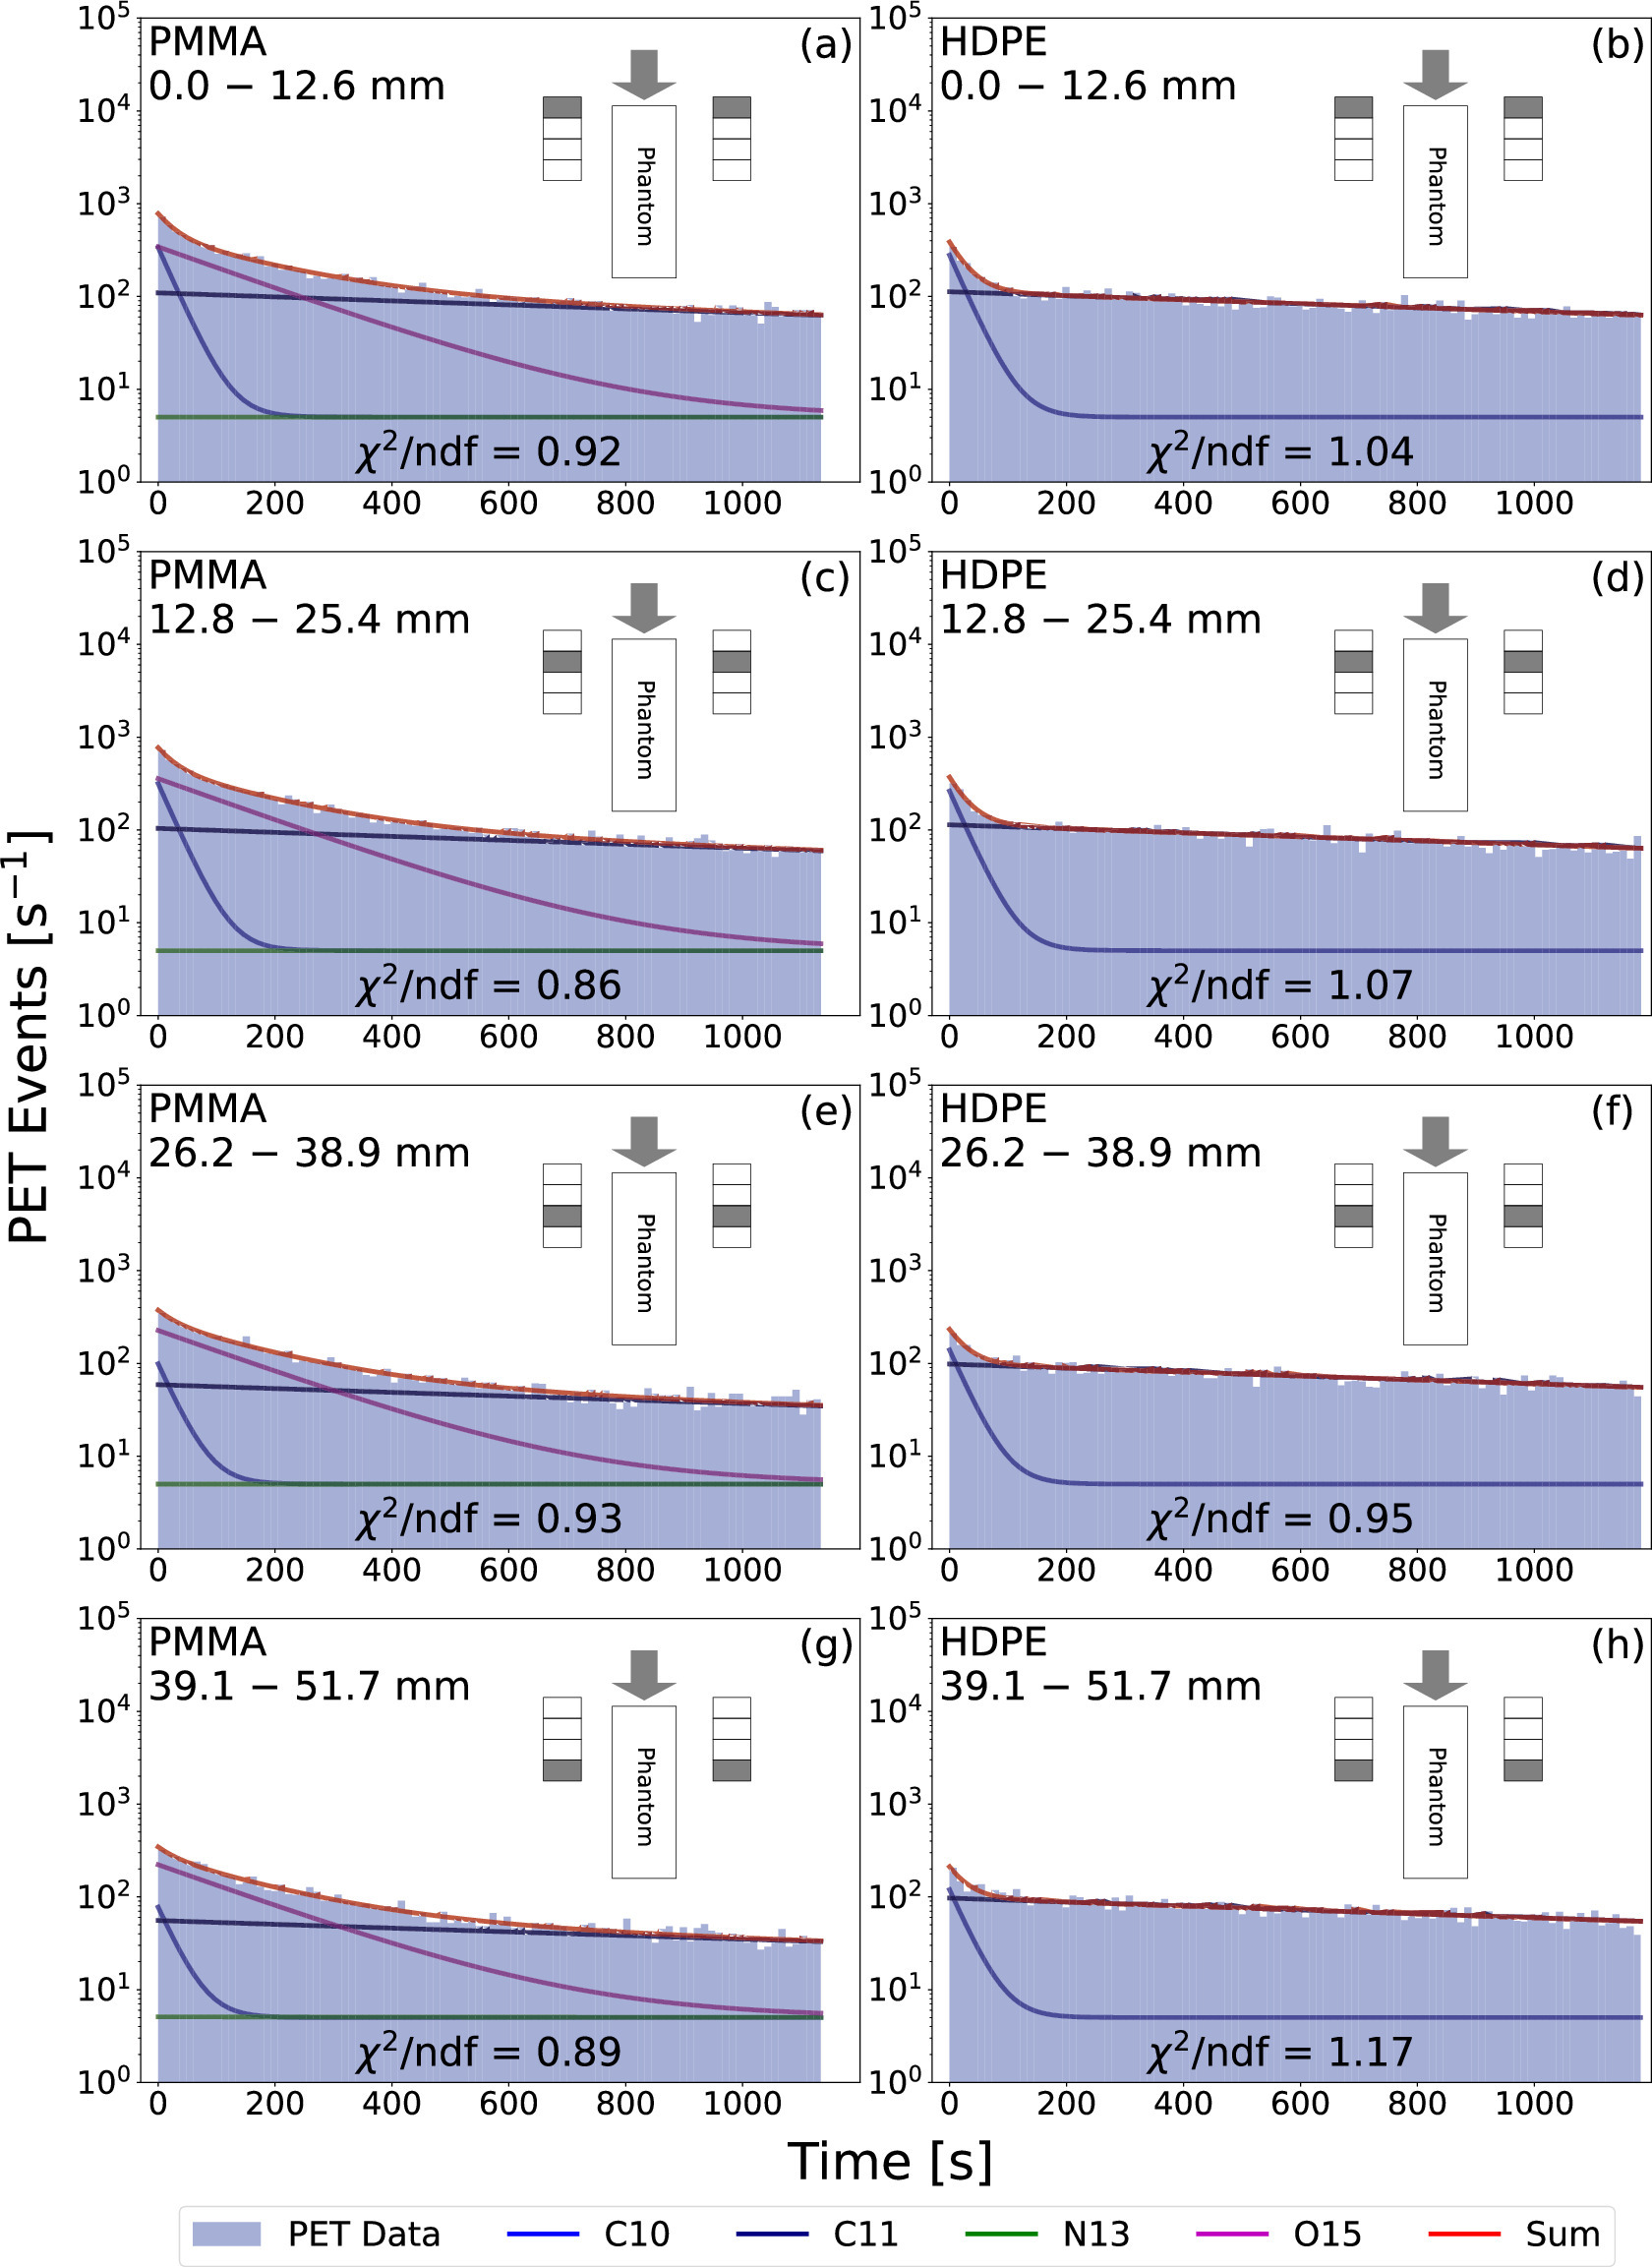
Figure 7: The post-spill coincidence time distributions from the 210 mm PMMA and HDPE data at different depths along each phantom. The corresponding exponential decay fits for each distribution are also plotted. In the inset of each subplot, a schematic of the experimental setup is displayed with the relevant spatial region highlighted in grey on each module (note that the distance between the PET modules and the phantom is not to scale). The grey arrows illustrate the beam direction. The distributions by panel go as follows: (a) PMMA from 0.0 to 12.6 mm, (b) HDPE from 0.0 to 12.6 mm, (c) PMMA from 12.8 to 25.4 mm, (d) HDPE from 12.8 to 25.4 mm, (e) PMMA from 26.2 to 38.9 mm, (f) HDPE from 26.2 to 38.9 mm, (g) PMMA from 39.1 to 51.7 mm, and (h) HDPE from 39.1 to 51.7 mm.
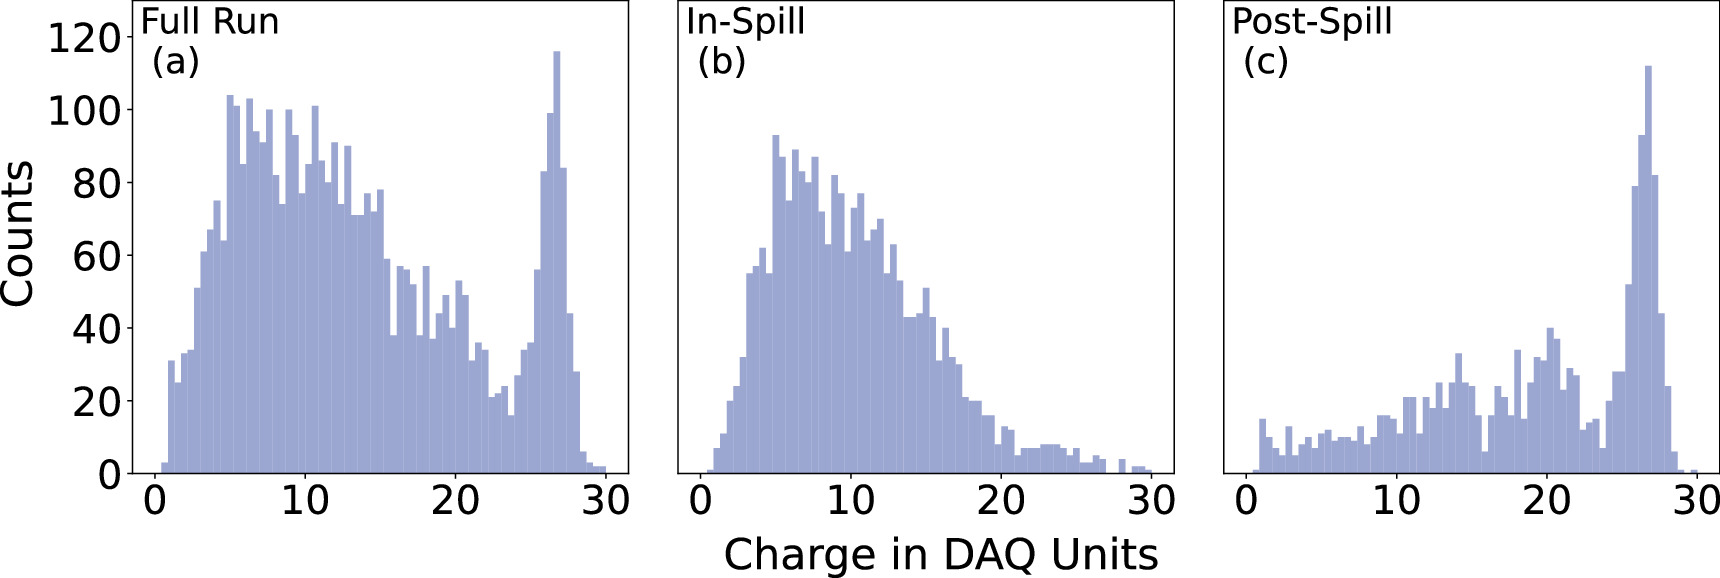
Figure 8: A typical energy spectrum in a single crystal pixel collected during the entire run [Panel (a)], during the beam spill [Panel (b)], and after the beam spill [Panel (c)]. The photopeak at data acquisition (DAQ) counts of about 27 is due to 511 keV gammas. The lack of a photopeak in the energy spectra for the data collected during the beam extraction (the 'in-spill' data) evinces that the radiation environment during the beam spill is dominated by prompt gammas.
Conceptual Designs
In addition to contributing to the TPPT collaboration, our group is investigating innovative geometries and data collection techniques that could usher forth a new generation of high-sensitivity PET scanners. For example, Fig. 9 shows one PET scanner design that we have developed, which would allow for unprecedented solid-angle coverage and time resolution, thus yielding an overall sensitivity far surpassing current state-of-the-art scanners. This design (and others that we are studying) would employ the technique of double-ended scintillator crystal readout. With this technique, the depth of gamma interaction (DOI) can be estimated for every event, allowing for corrections to the measured trigger time and therefore vastly improved time resolution. This DOI estimation also allows for the minimization of parallax error, resulting in improved spatial resolution. We are currently investigating this technique and the overall design of Fig. 9 through simulation and benchtop studies, along with other conceptual designs. We hope to begin empirical tests at a larger scale in the near future.
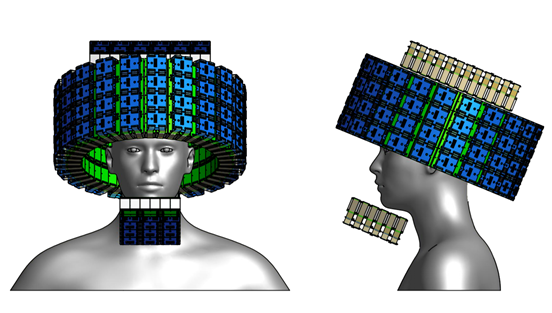
Figure 9: Conceptual design for an ultra-high sensitivity PET scanner.
Figure 10: The coronal (top panel) and axial (bottom panel) views of PET images produced using the CASToR imaging package (Merlin et al 2018 ). The color scale is arbitrary. The cylindrical PMMA 2 phantom is outlined by a rectangle and a circle, and the field of view boundaries are indicated by orange lines. Data were taken in Run 4. For creating these images we used a voxel size of 1.5 × 1.5 × 1.5 mm3 and the results of iteration 5 are shown. The black bars denote the sum of coincidence counts in columns or rows of pixels. Red bars signify a column or a row that includes either a dead or a noisy pixel and thus the counts are less reliable.
Figure 11: Animations of coronal PET imaging captured in 120 s long or 90 s longtime periods, marked above each frame, for PMMA, HDPE, and water phantoms, respectively. The field of view boundaries are indicated by orange lines. The Geant4 simulated activity produced by the proton beam is shown in two-dimensional plot on the right. Note, the activation cross-sections and diffusion in water affect the imaging of this phantom. A cylindrical scanner with additional modules would substantially improve the quality of imaging.
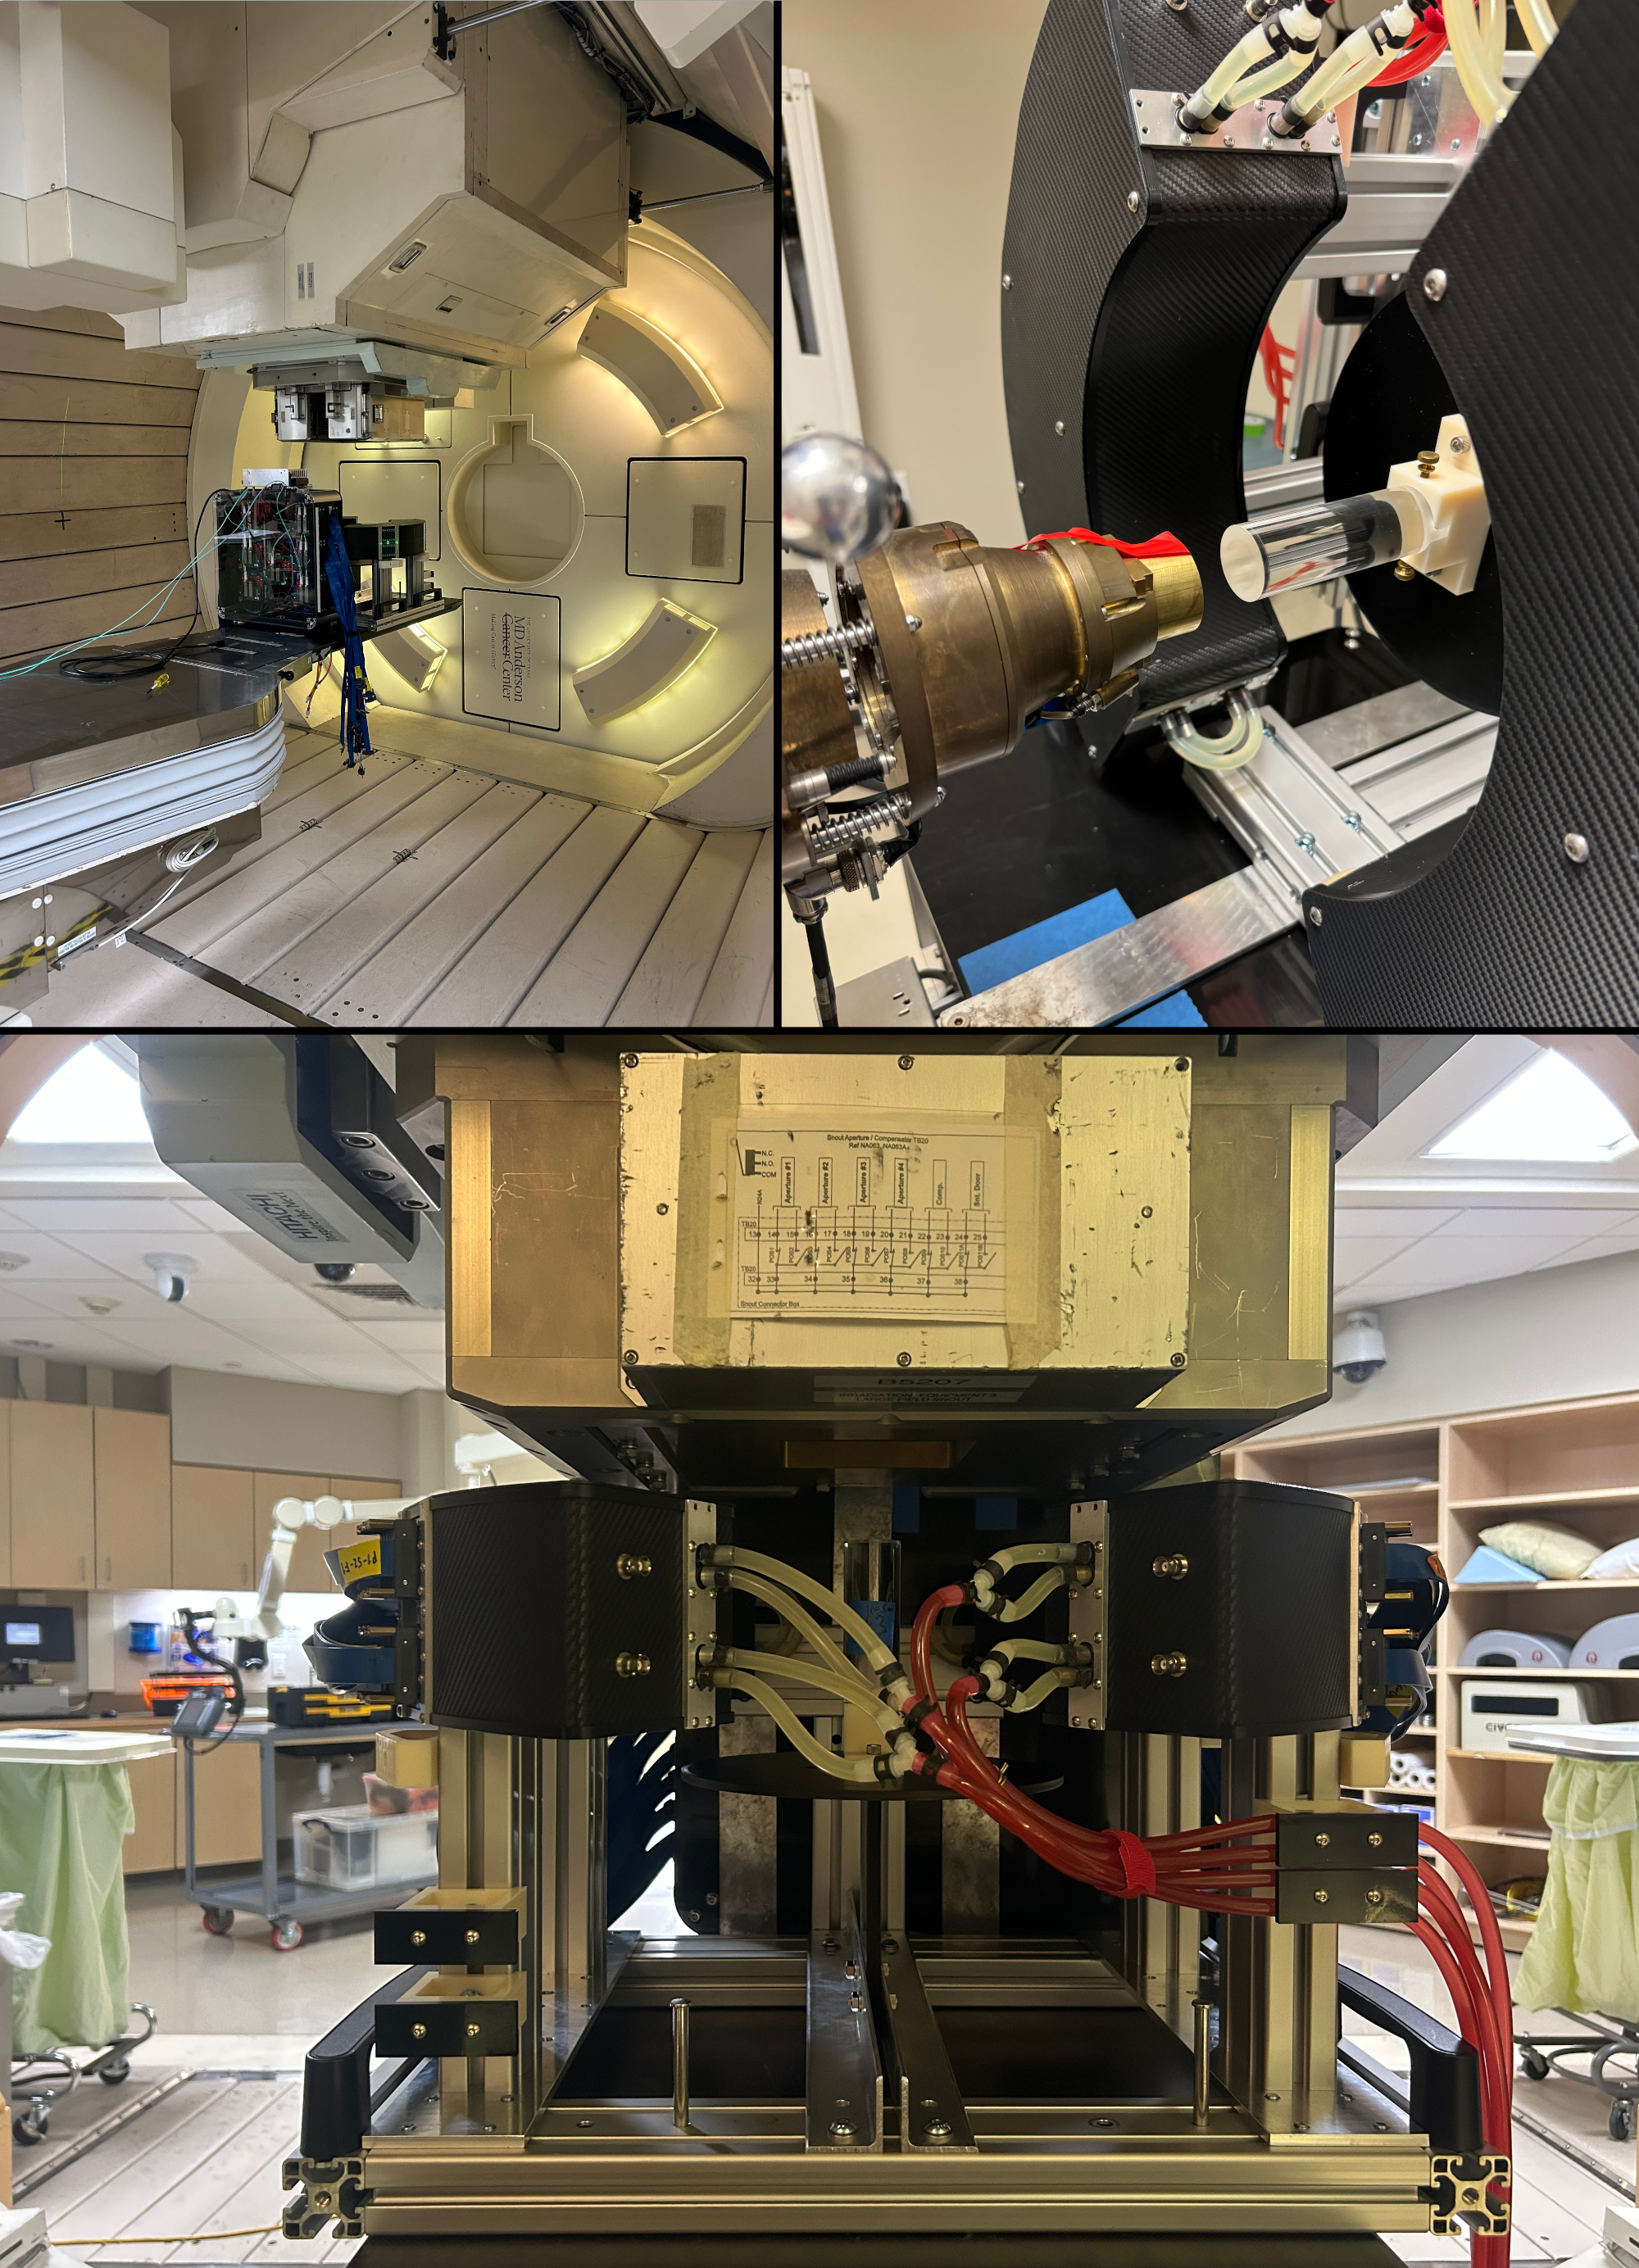
Figure 12: The PET scanner at MD Anderson Cancer center at Houston