Neutrino oscillations are a quantum mechanical phenomenon whereby a neutrino created with a specific lepton flavor (electron, muon, or tau) can later be measured to have a different flavor. The probability of measuring a particular flavor for a neutrino varies periodically as it propagates through space, depending both on the energy of the neutrino and the distance it traveled.
Learn about neutrino oscillations and how we study this phenomenon in MINOS/MINOS+ and NOvA. We also participate in simulation efforts for the future DUNE experiment.
MINOS or Main Injector Neutrino Oscillation Search was an on-axis long-baseline neutrino oscillation experiment that was exposed to the the NuMI neutrino beam from Fermilab. It used a Near Detector (ND) with a mass of 0.98 metric-kiloton located 1.04km from the NuMI target and a Far Detector (FD) with a mass of 5.4 metric-kiloton located 735km from the target in the Soudan Underground Mine. These detectors were functionally equivalent magnetized steel-scintillator, tracking-sampling calorimeters. The detectors consisted of alternating planes of 2.54cm thick steel plates and 1cm thick polystyrene-based (plastic) scintillator strips. The scintillation light resulting from particle interactions, following the initial neutrino interaction was collected and guided by wavelength-shifting (WLS) fibers to photomultipliers (PMTs). The PMT signals were used to determine the flavor and energy of the interacting neutrino. Each detector was magnetized by a coil that ran through the center of the detector, parallel to its length. The magnetic field allowed the MINOS detectors to distinguish between and charged-current (CC) interactions based on the curvature of the resulting muon. The ND was used to monitor the neutrino beam before significant neutrino oscillations take place. The FD was used to measure the deficit in neutrino events due to oscillations occurring along the way from Fermilab to Soudan, a trip that takes less than 3 milliseconds for these neutrinos. Fig. 1 and Fig. 2 illustrate the basic design of the MINOS detectors.
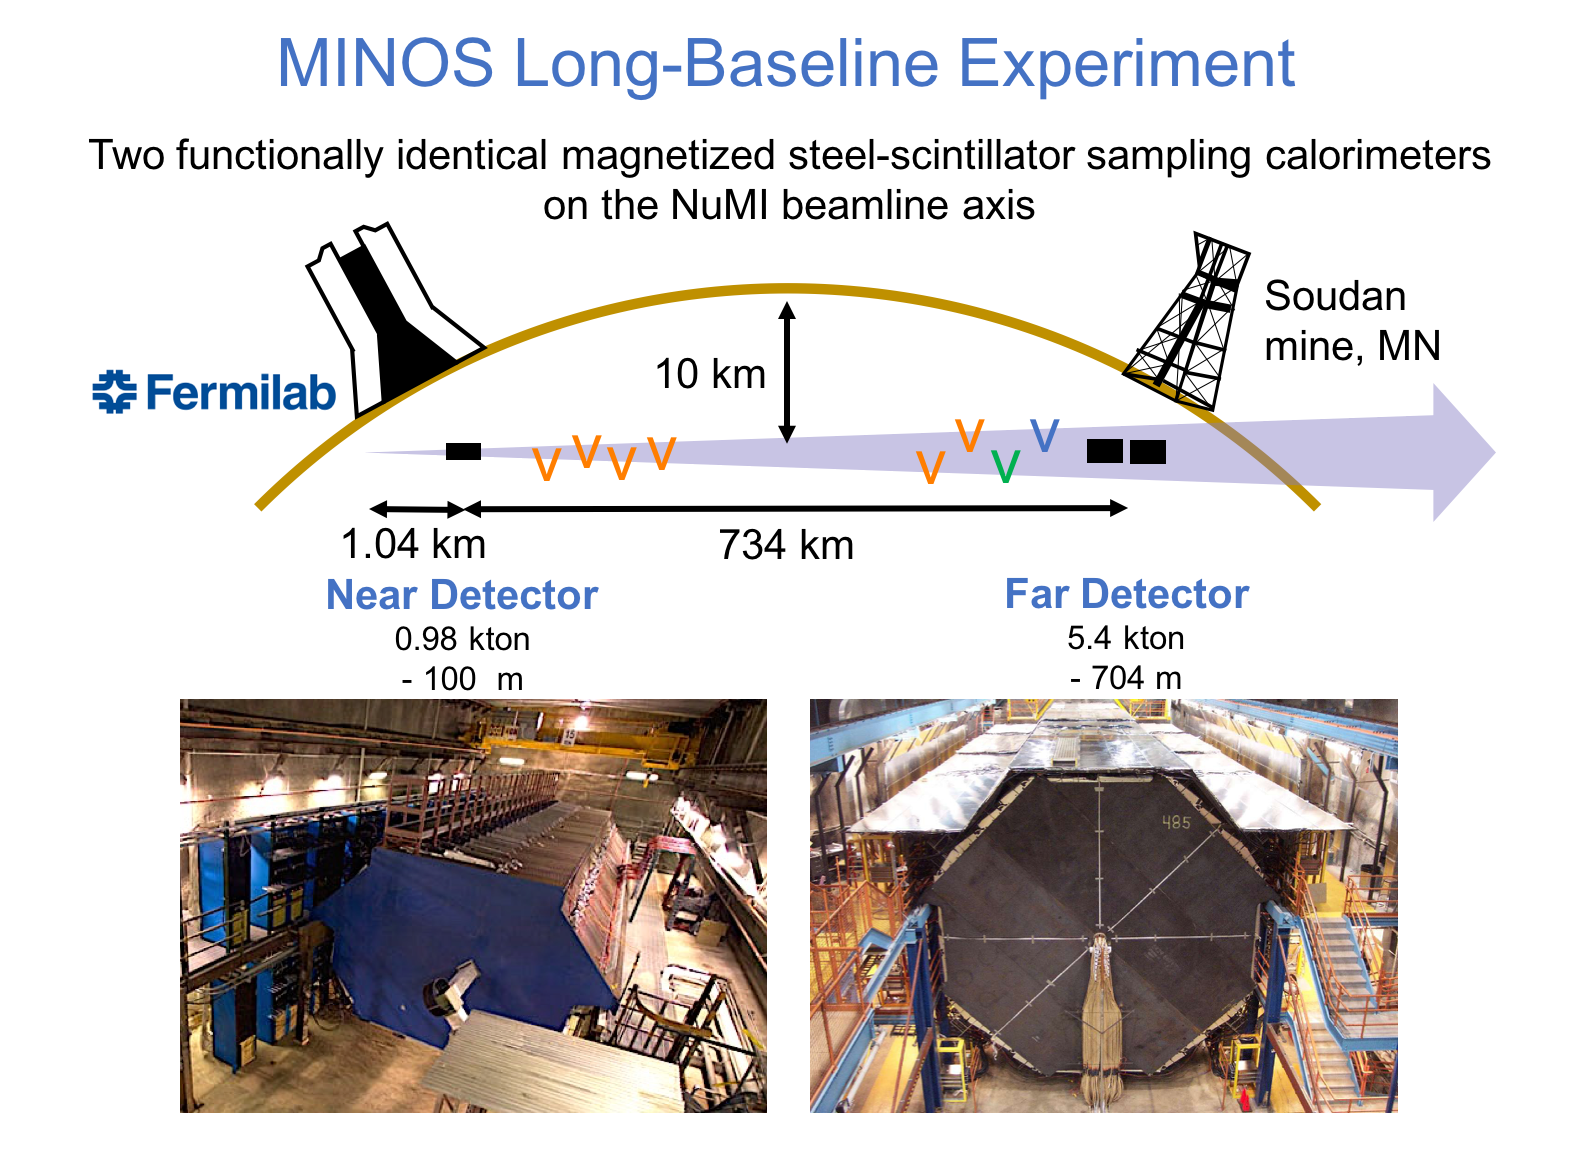
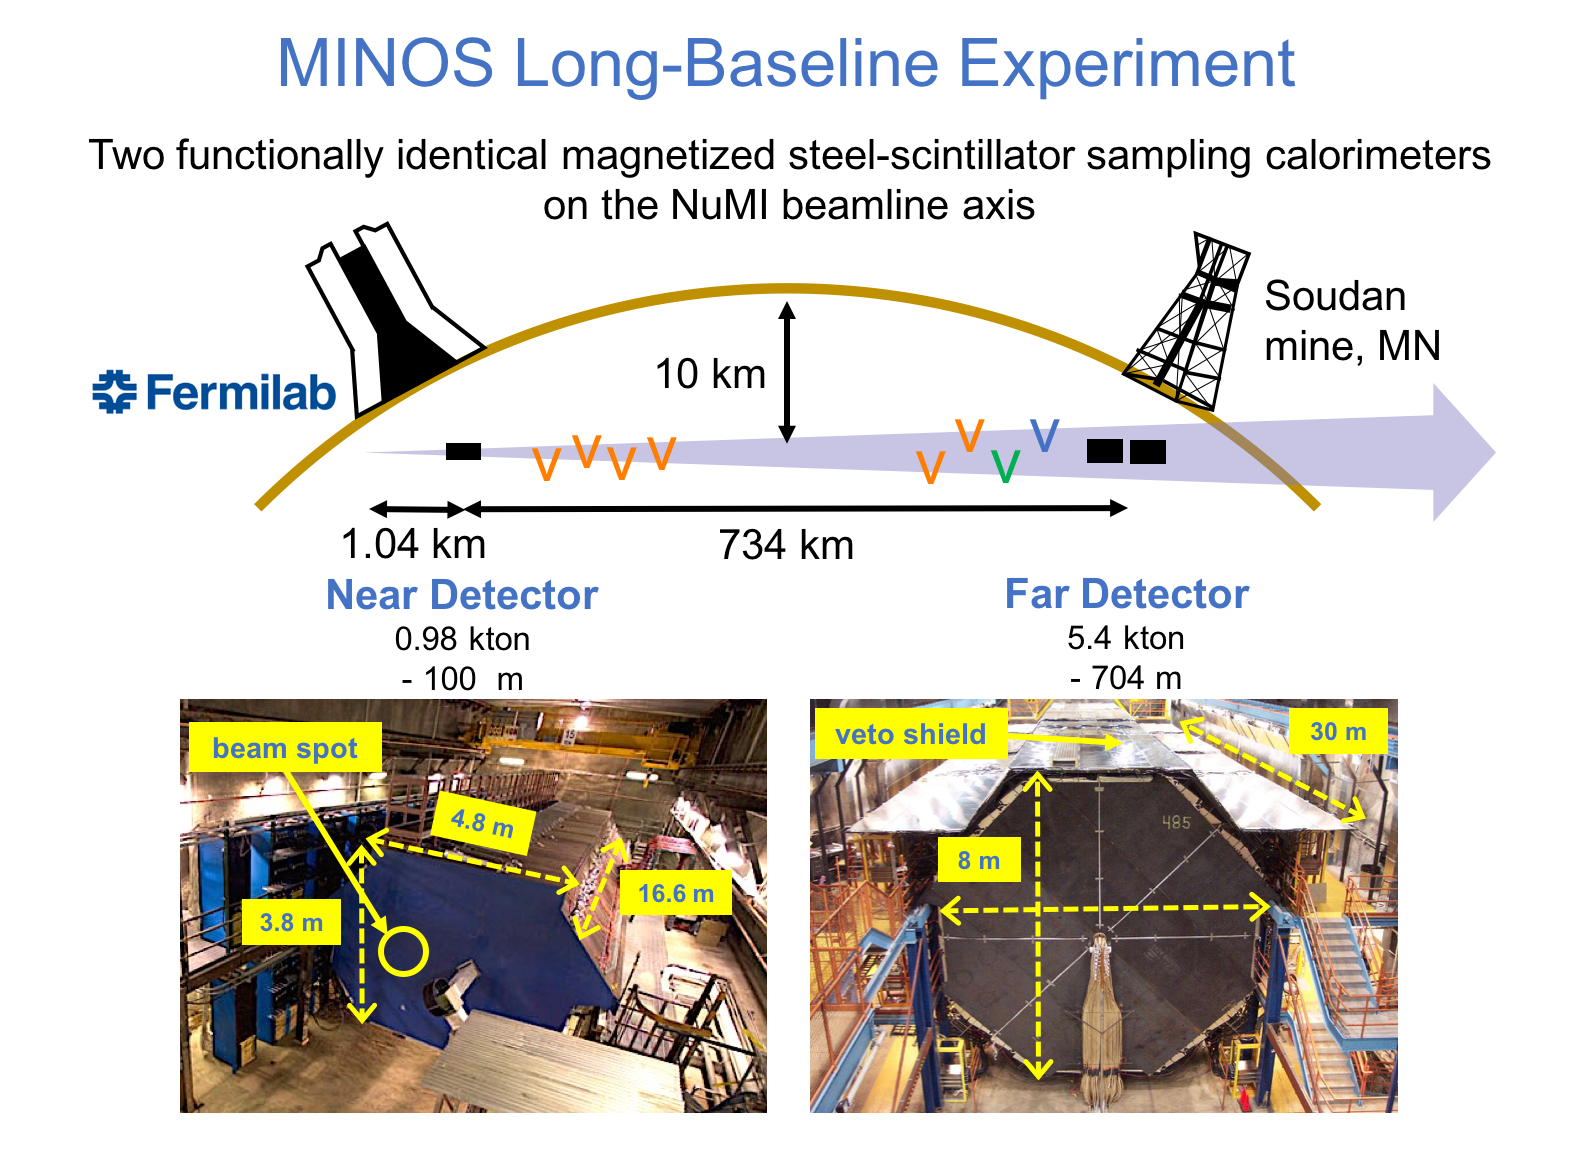
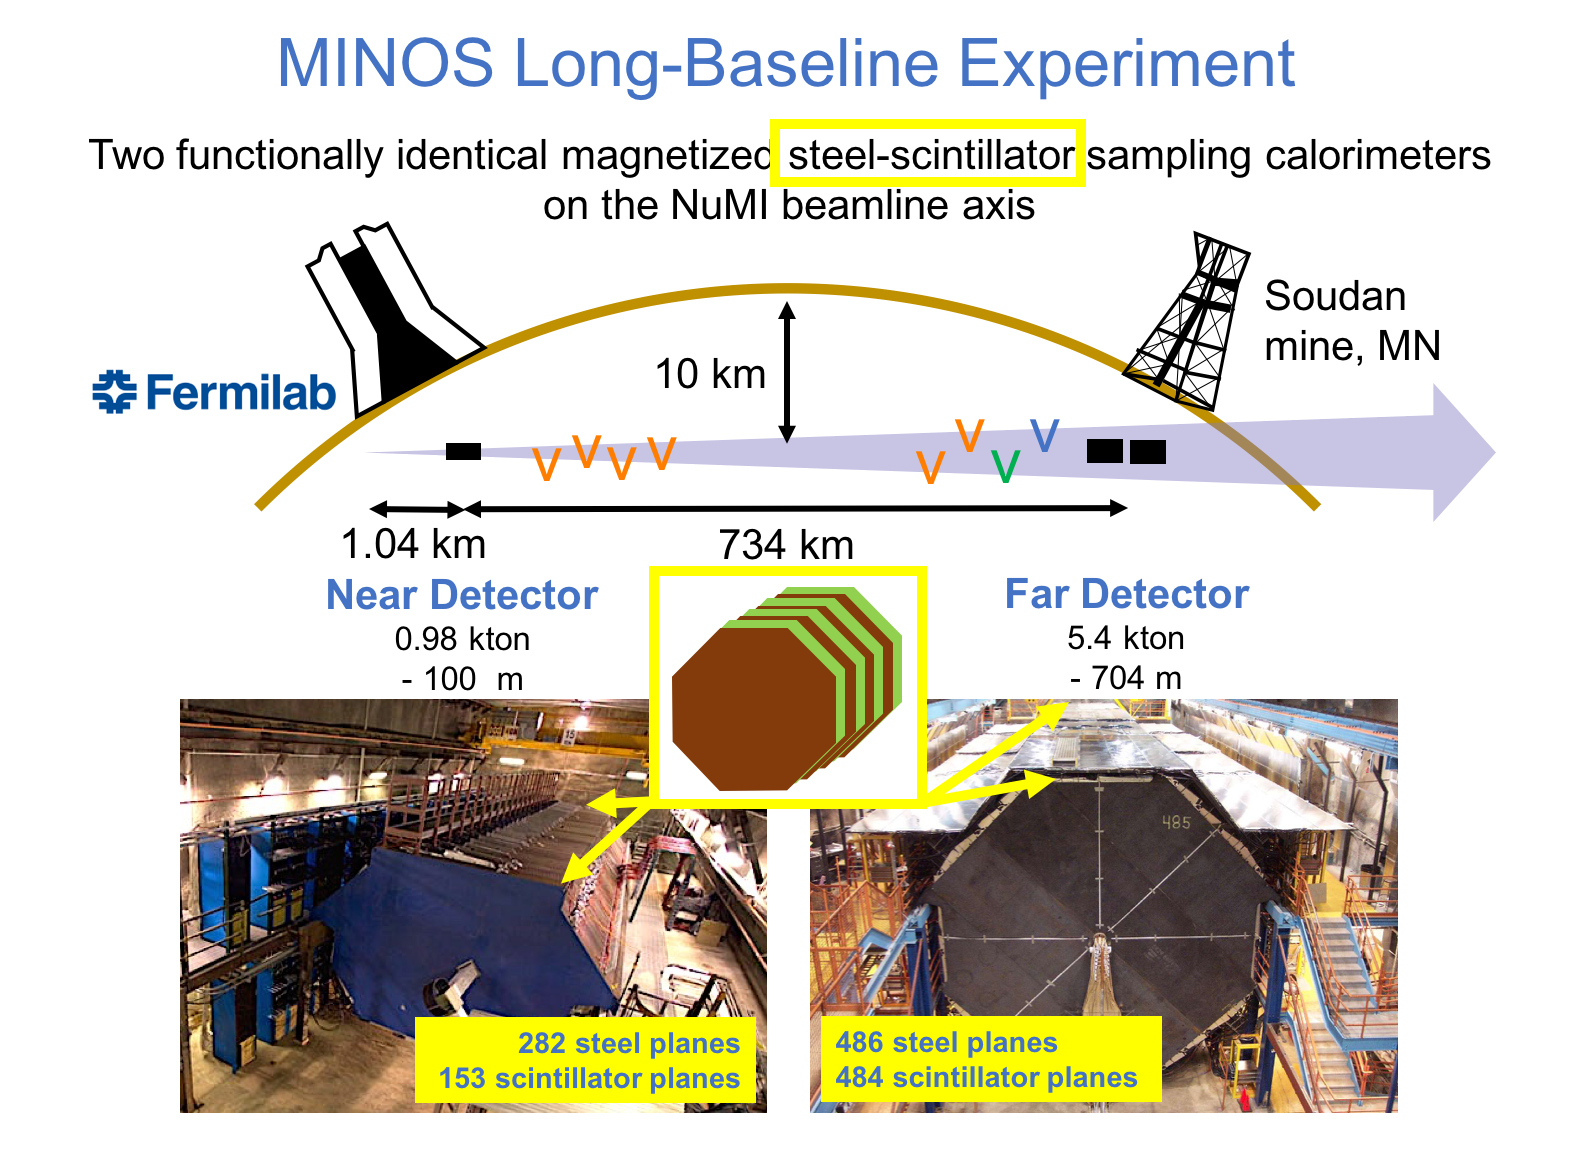
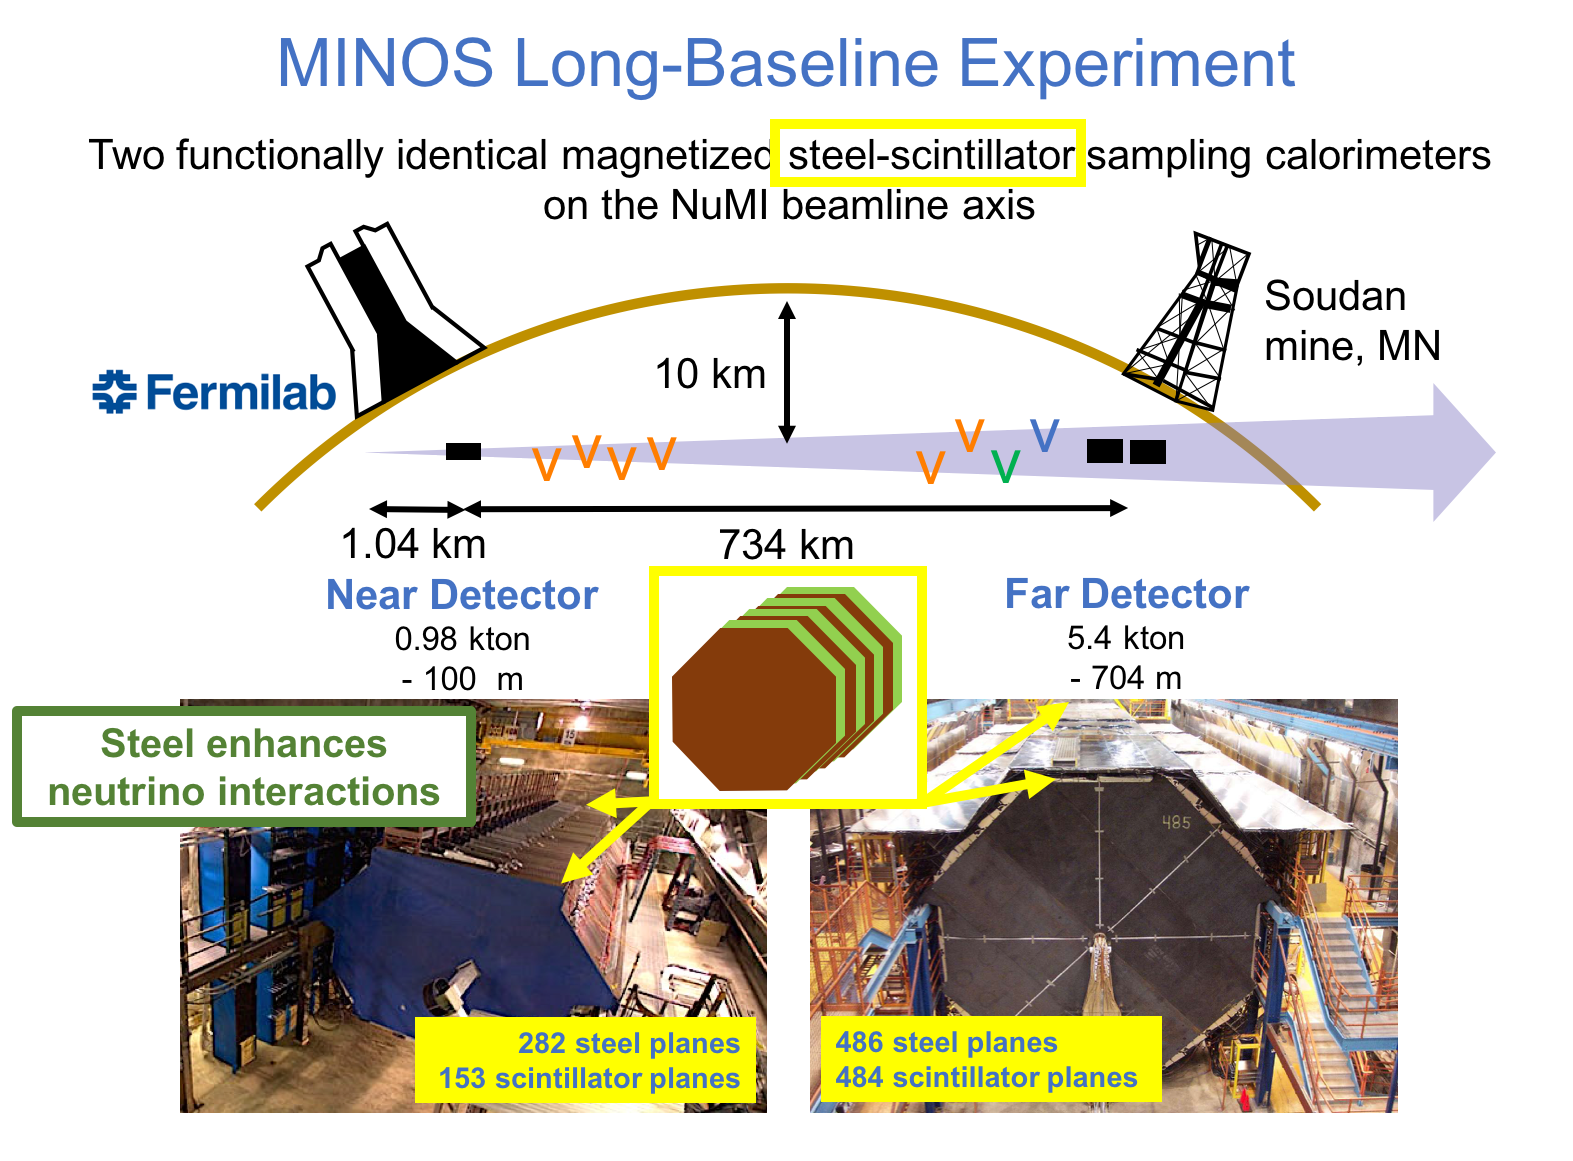
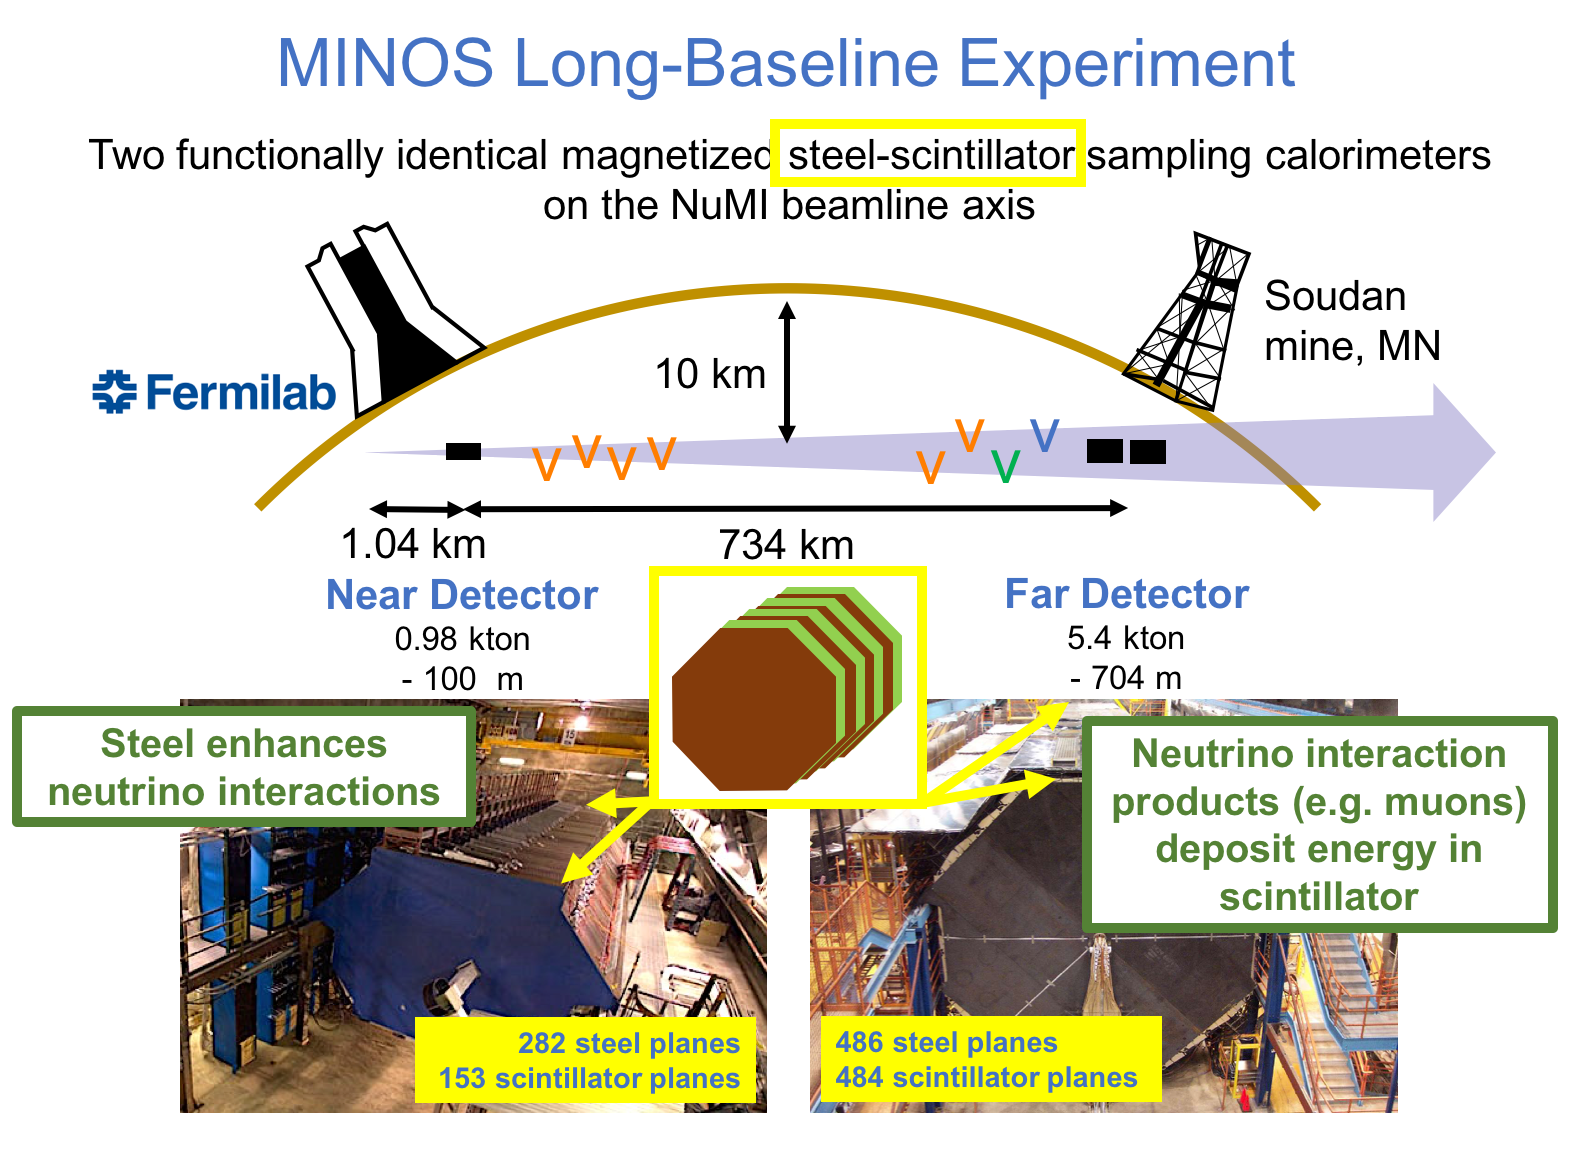
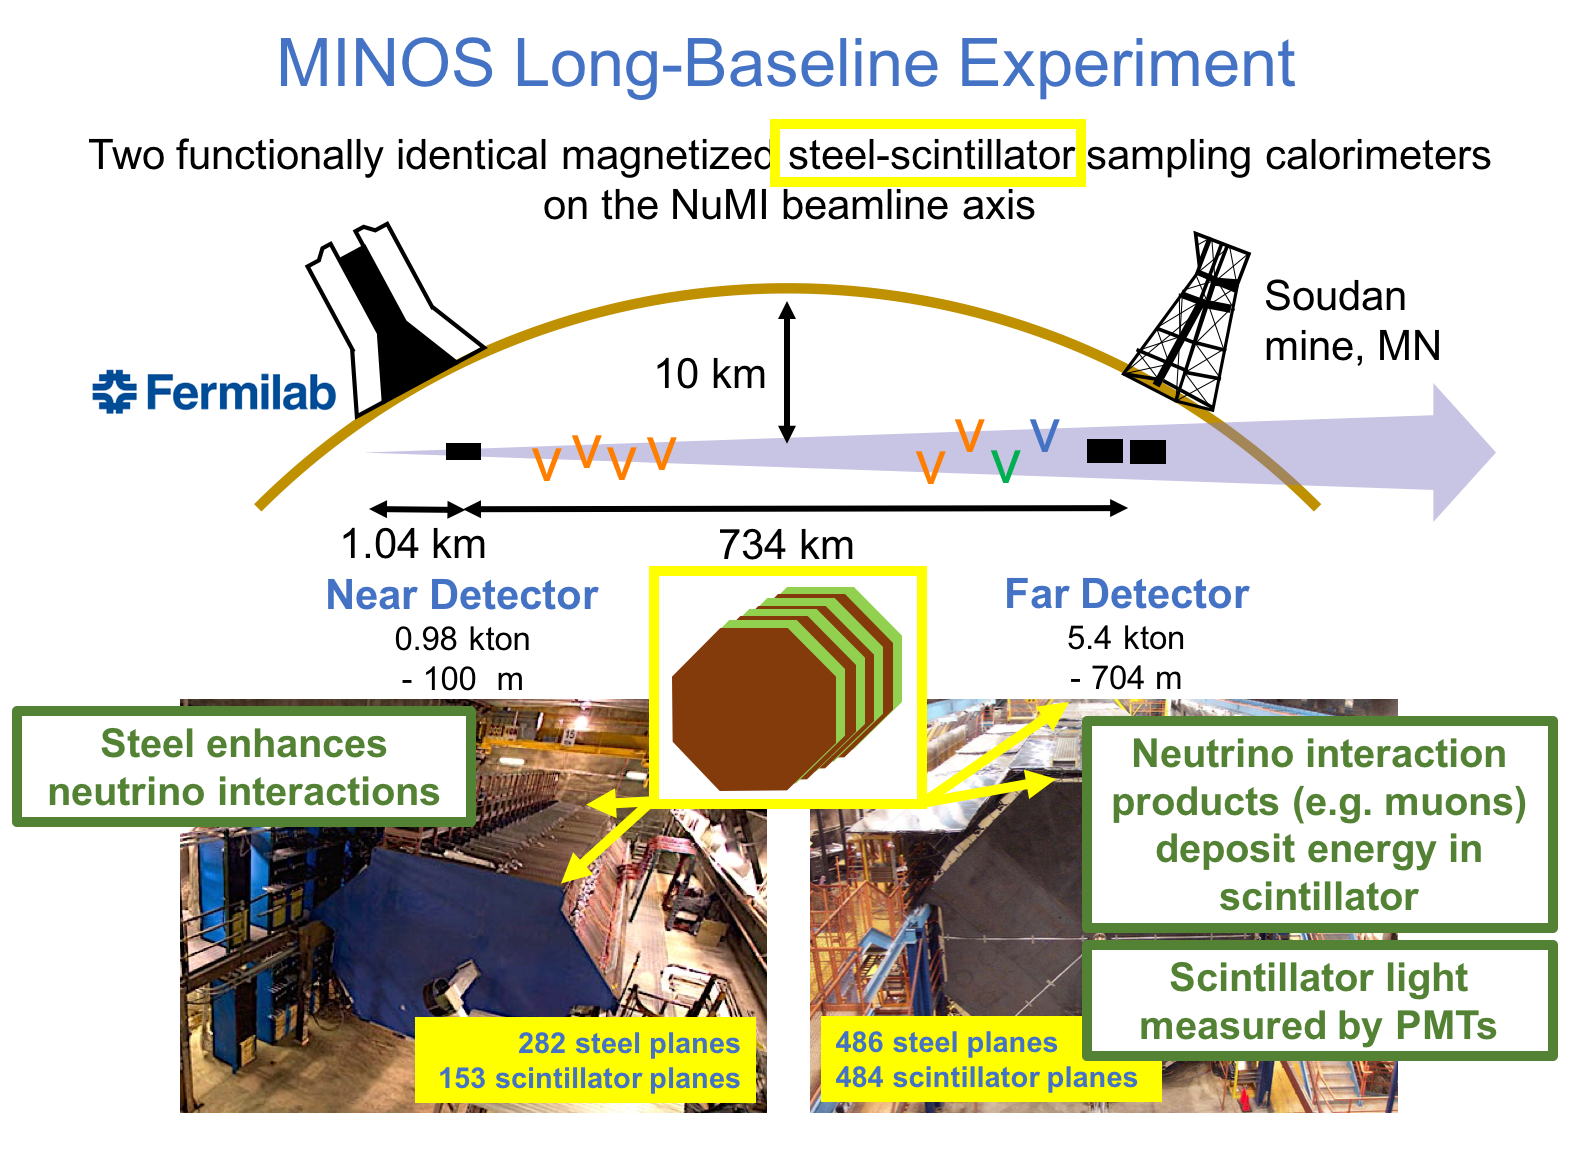
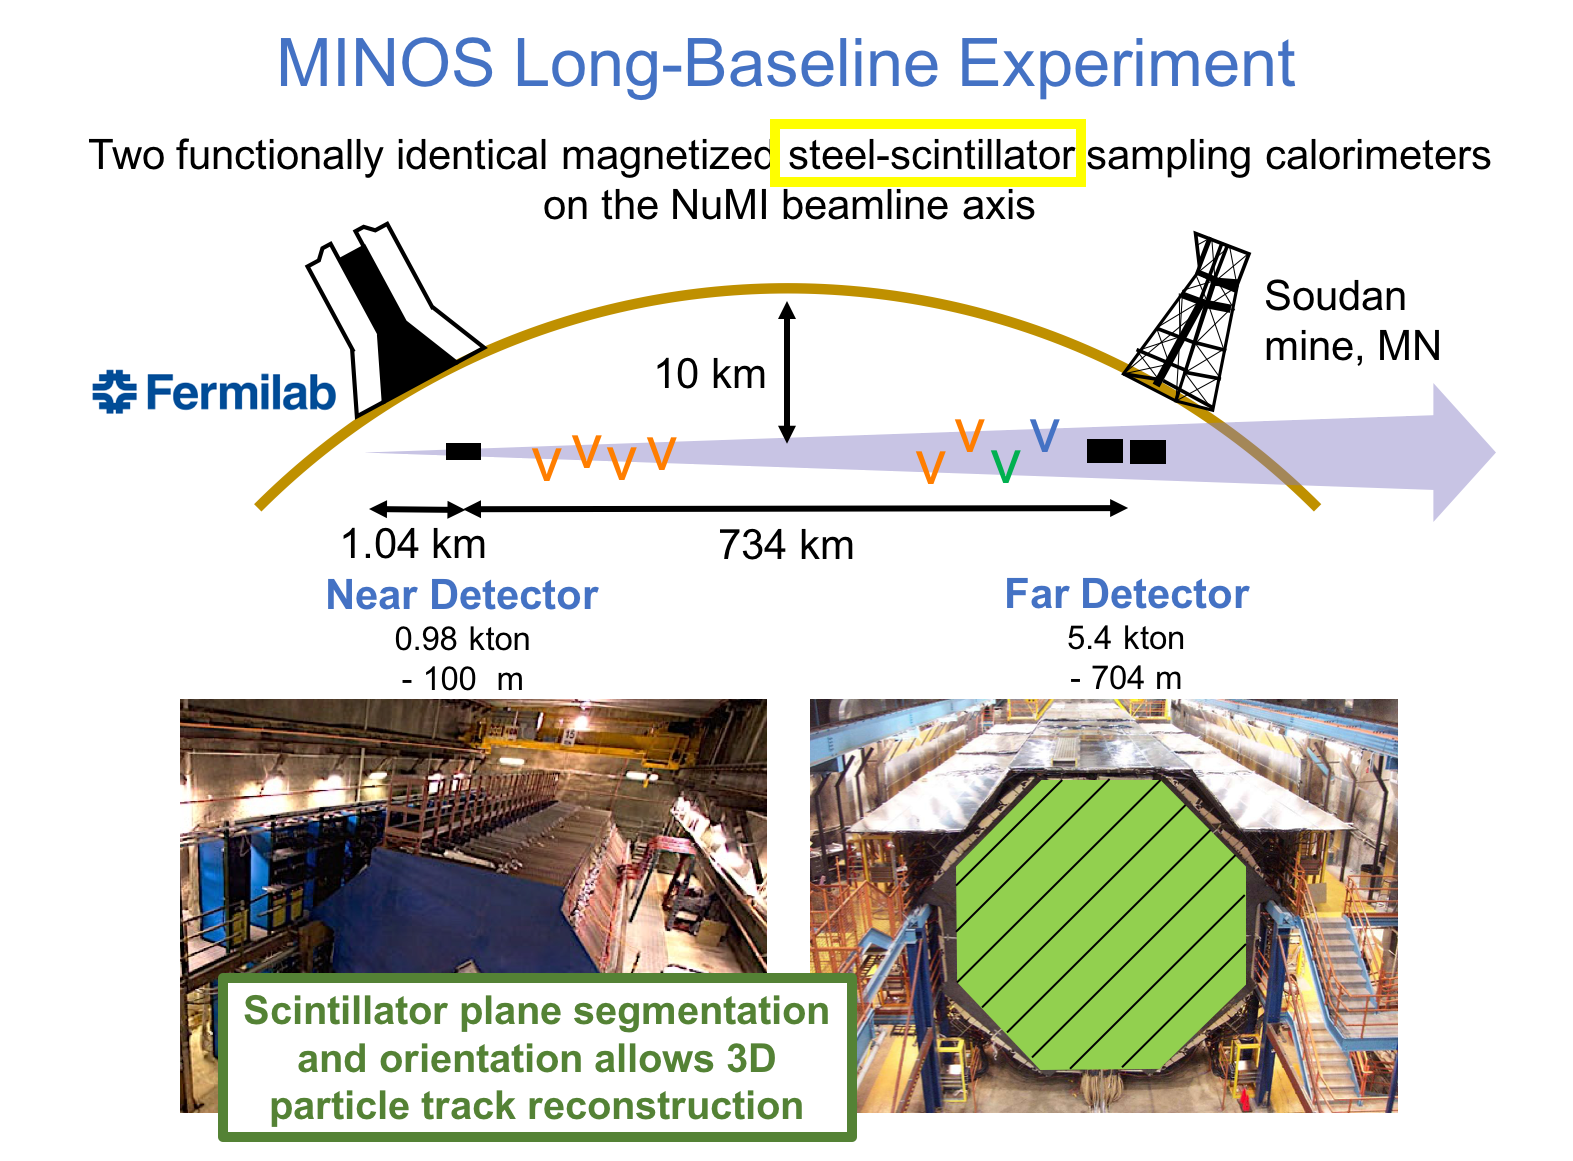
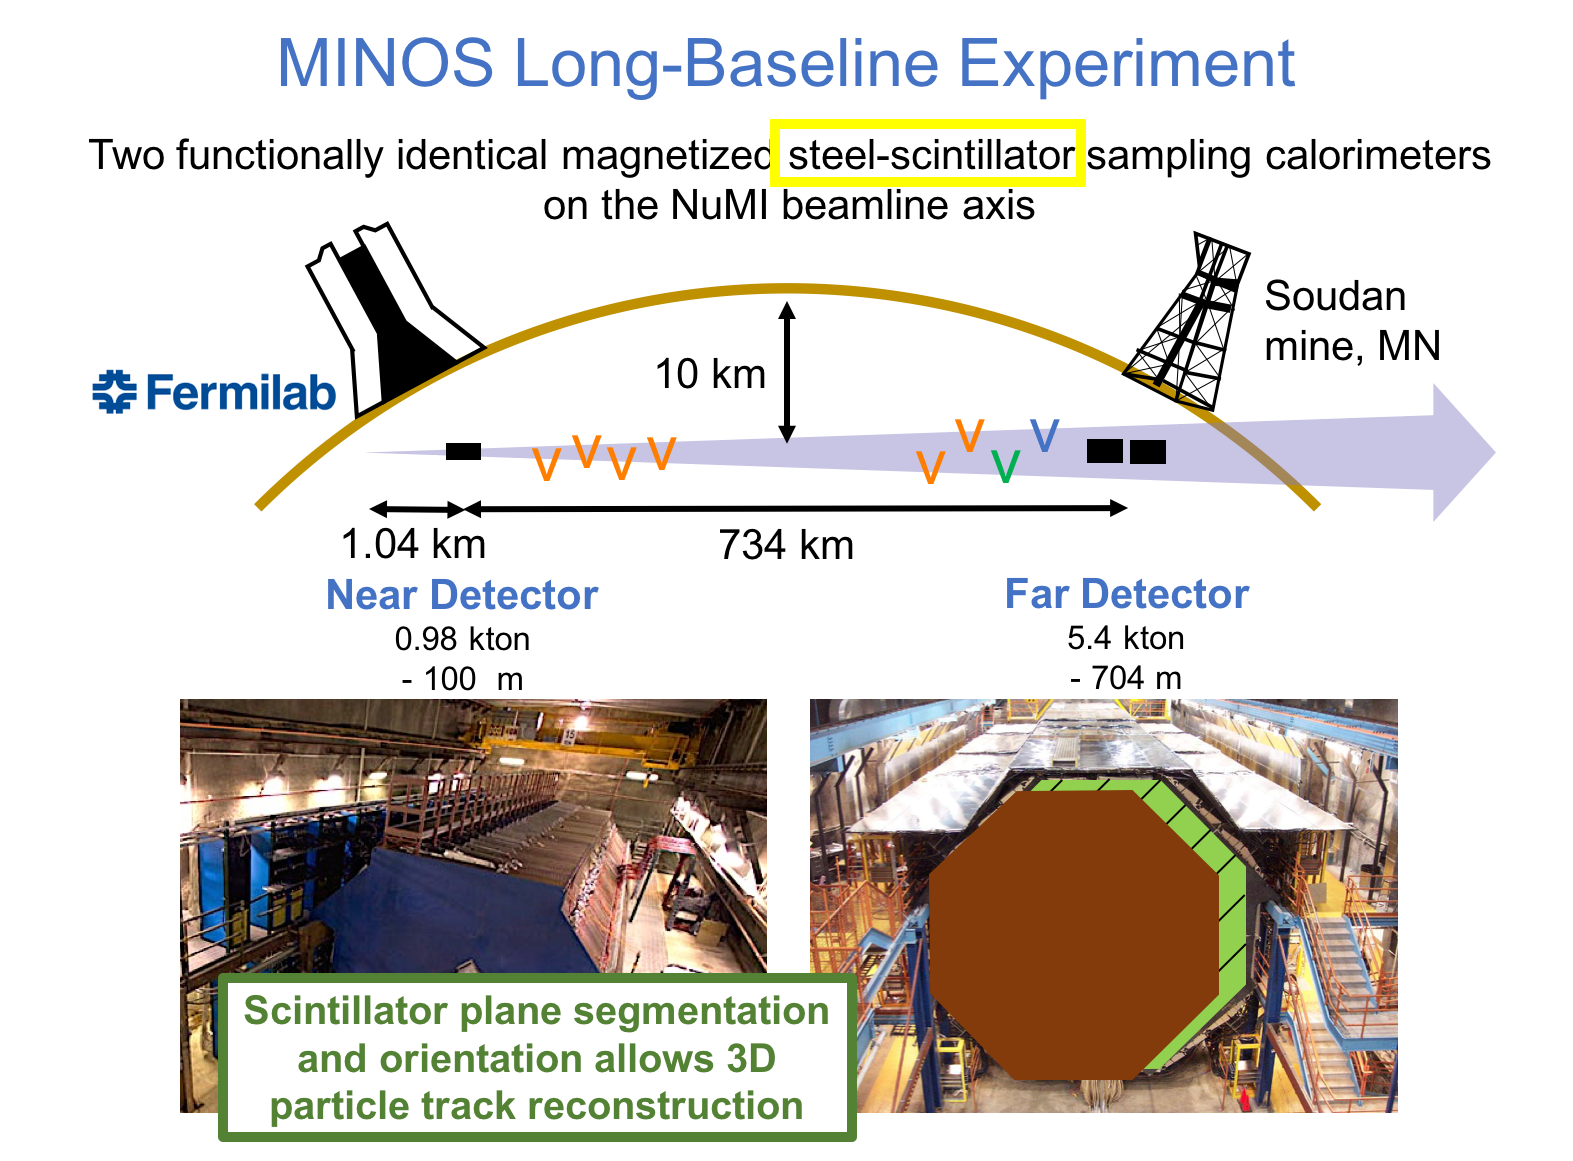
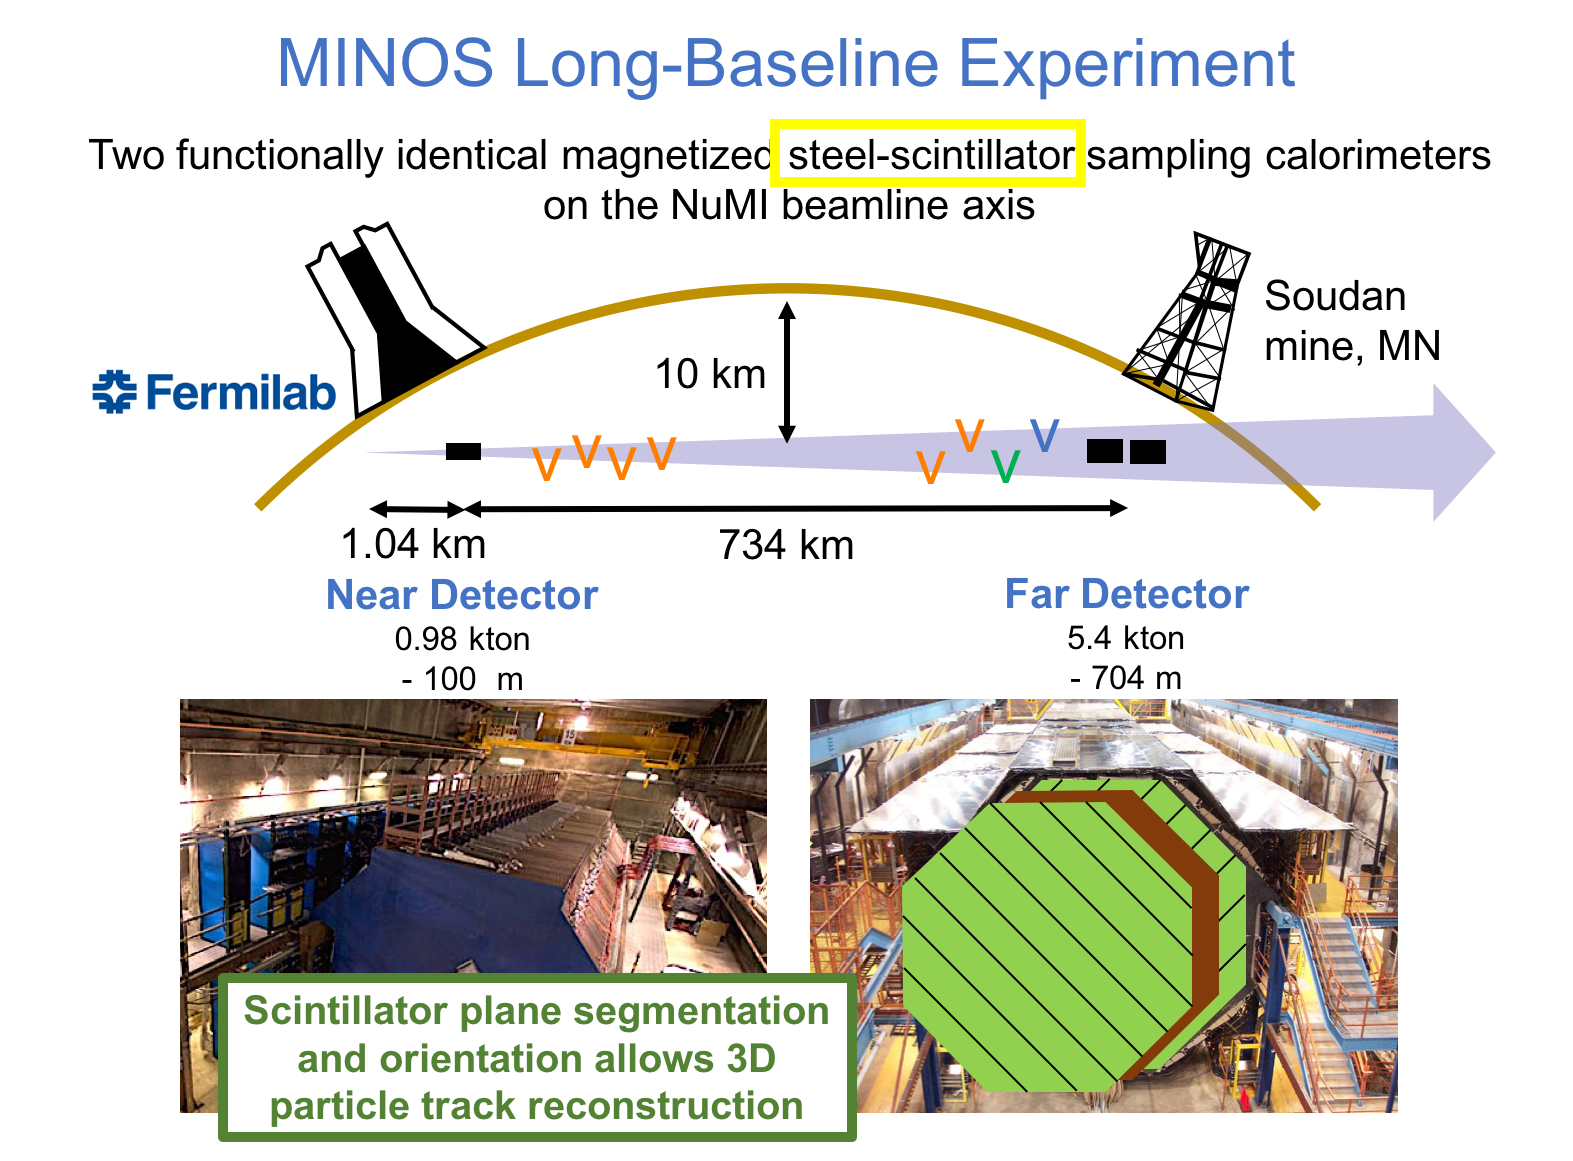
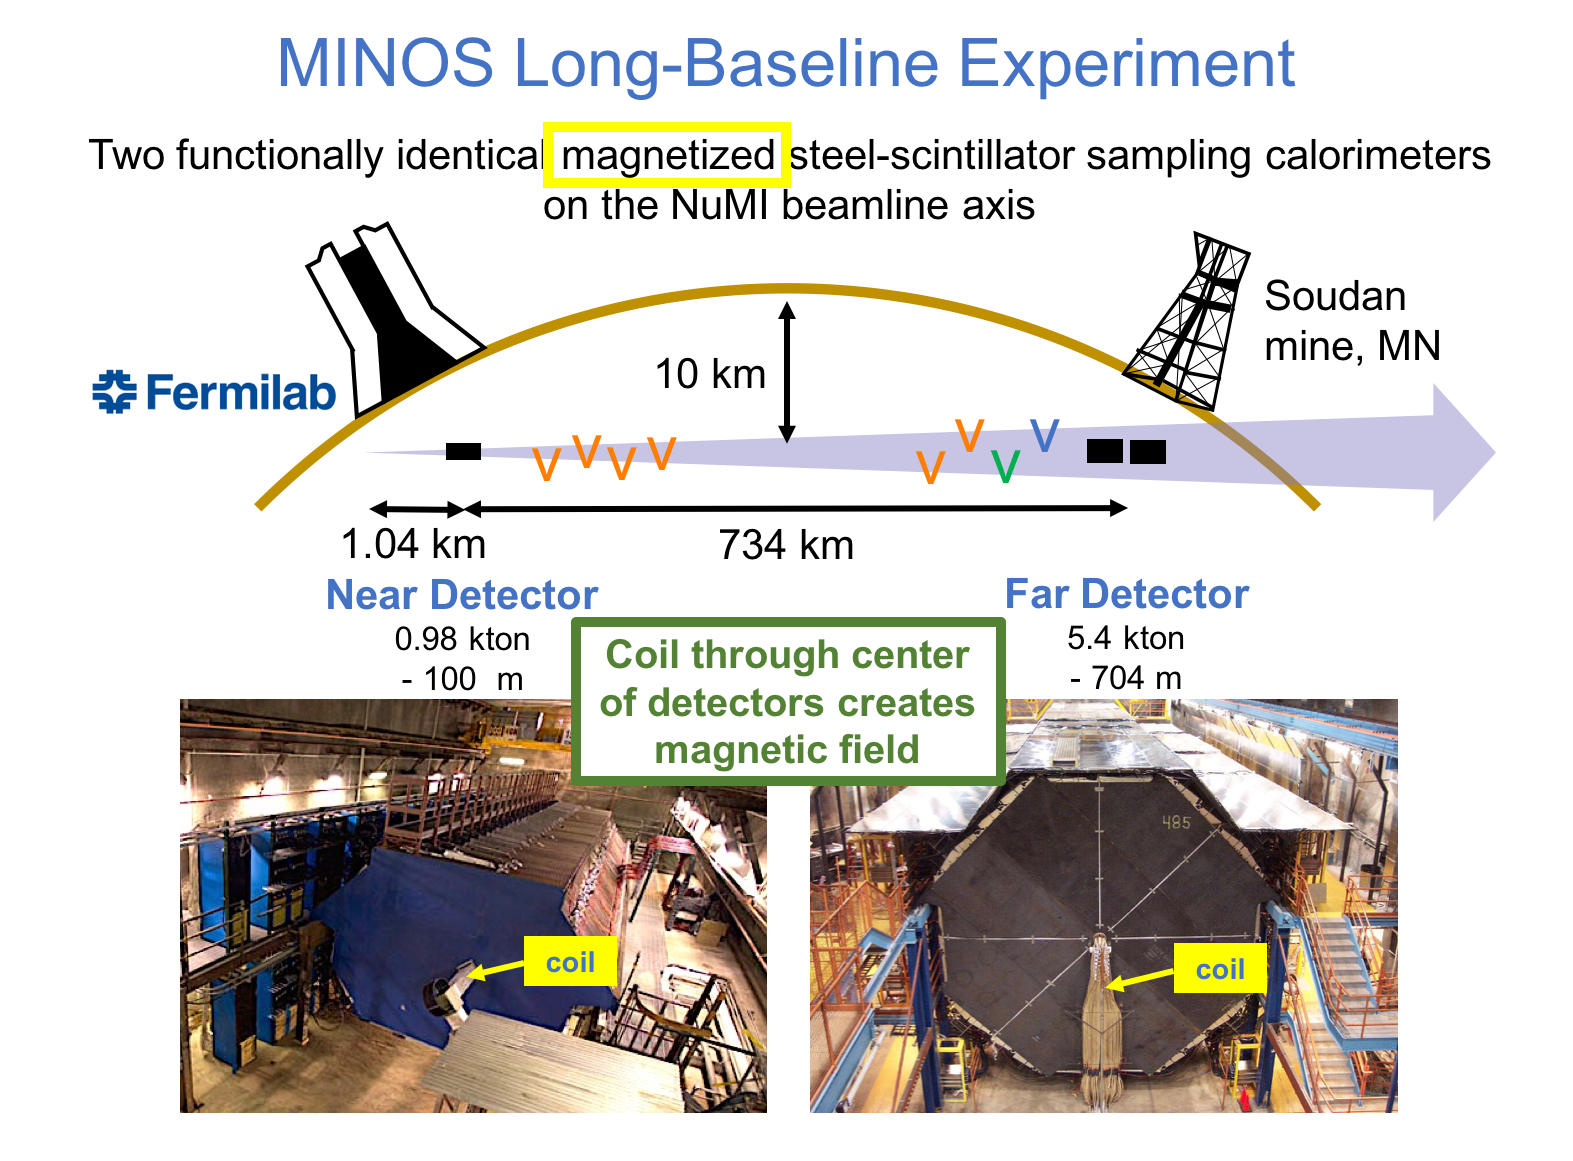
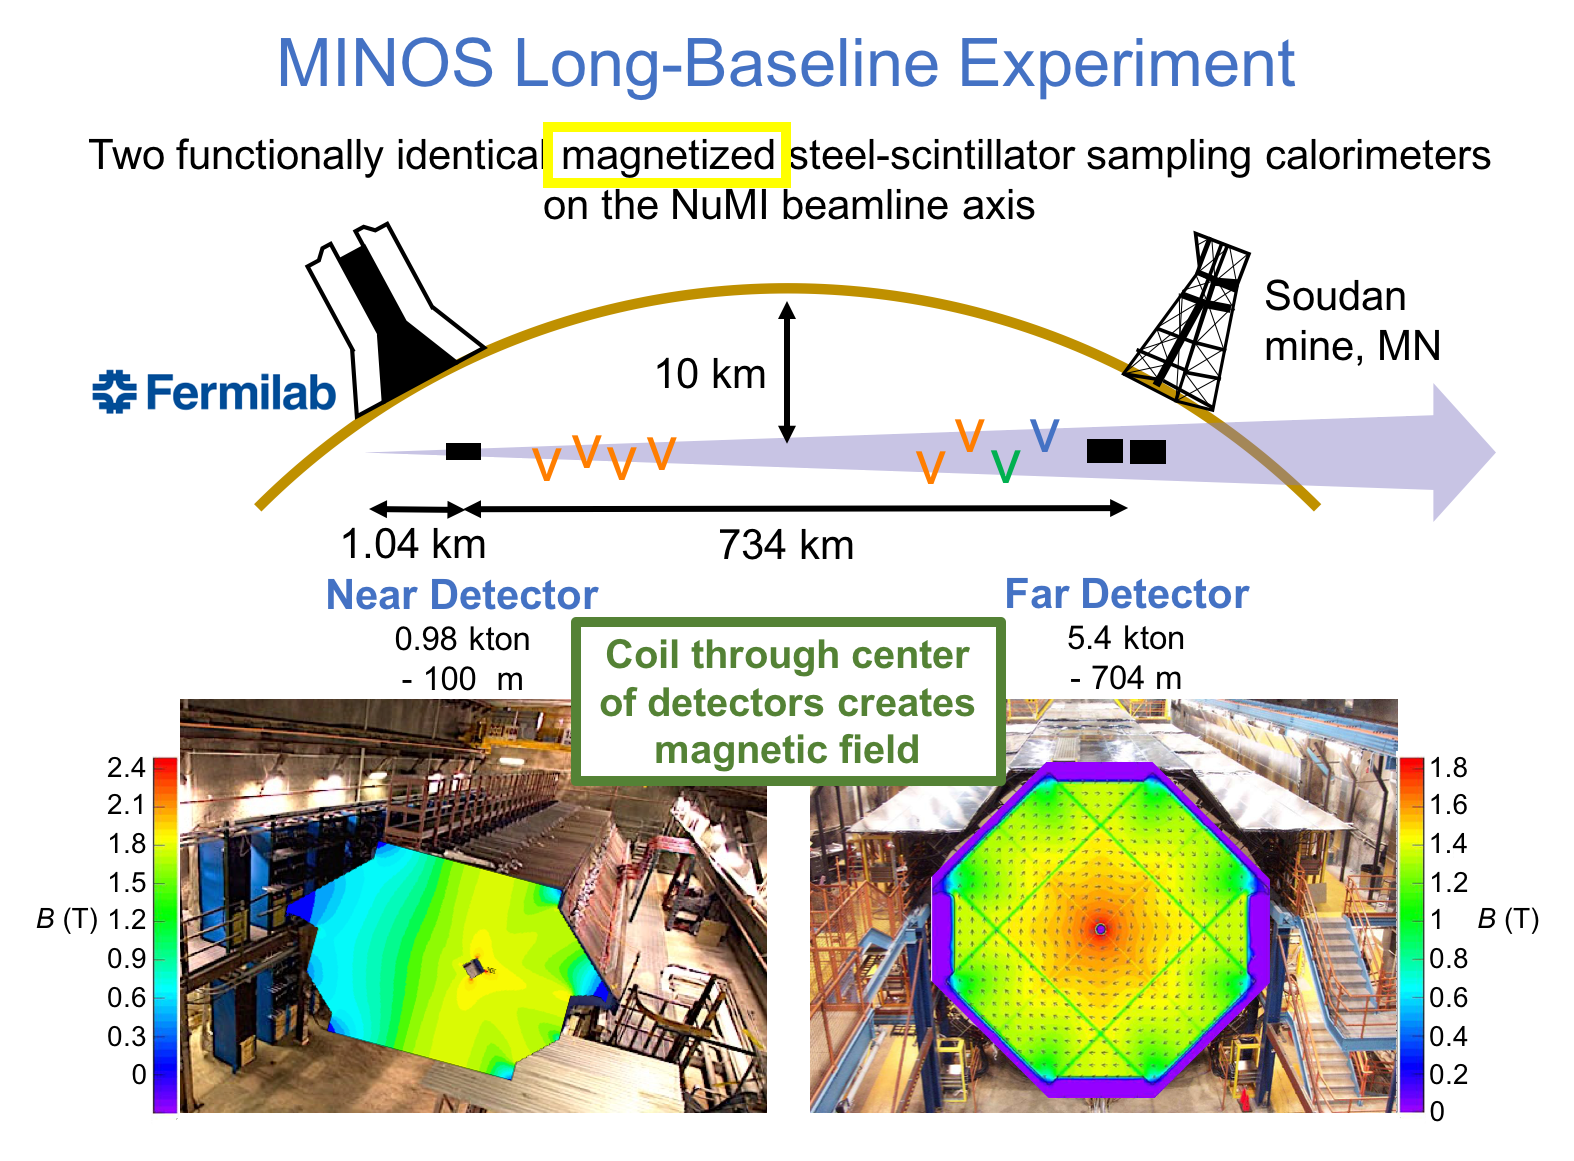
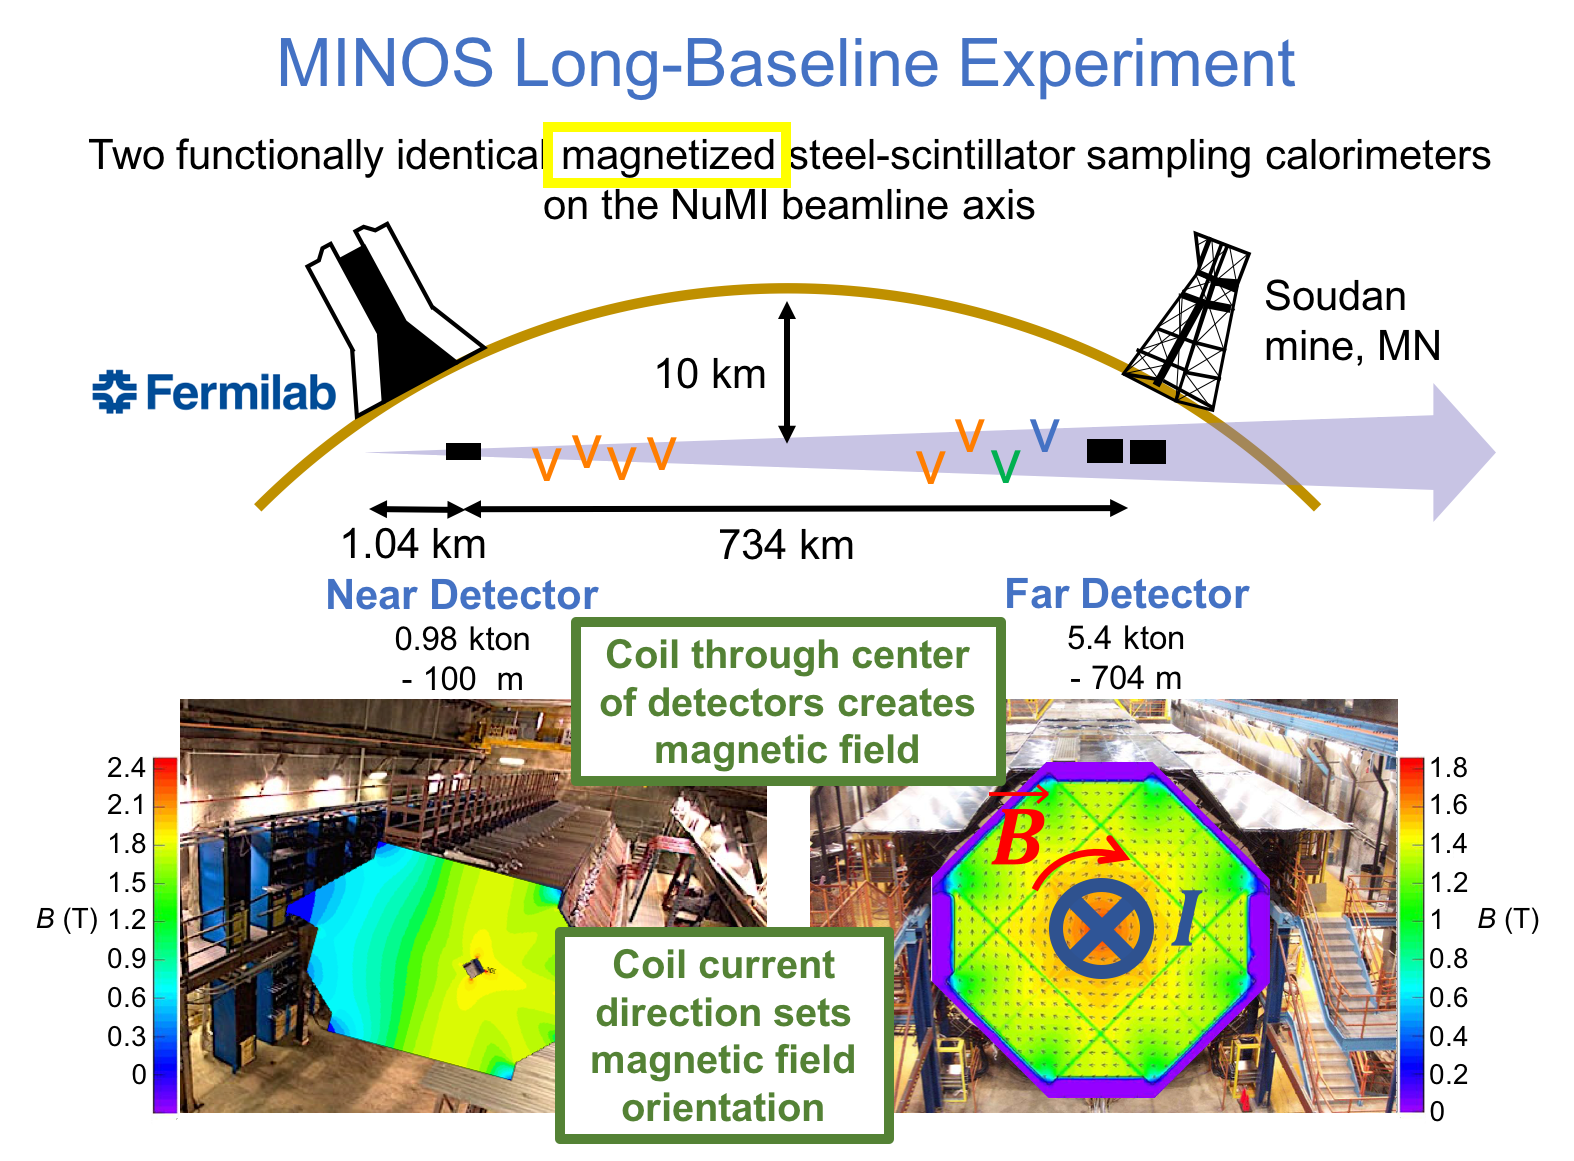
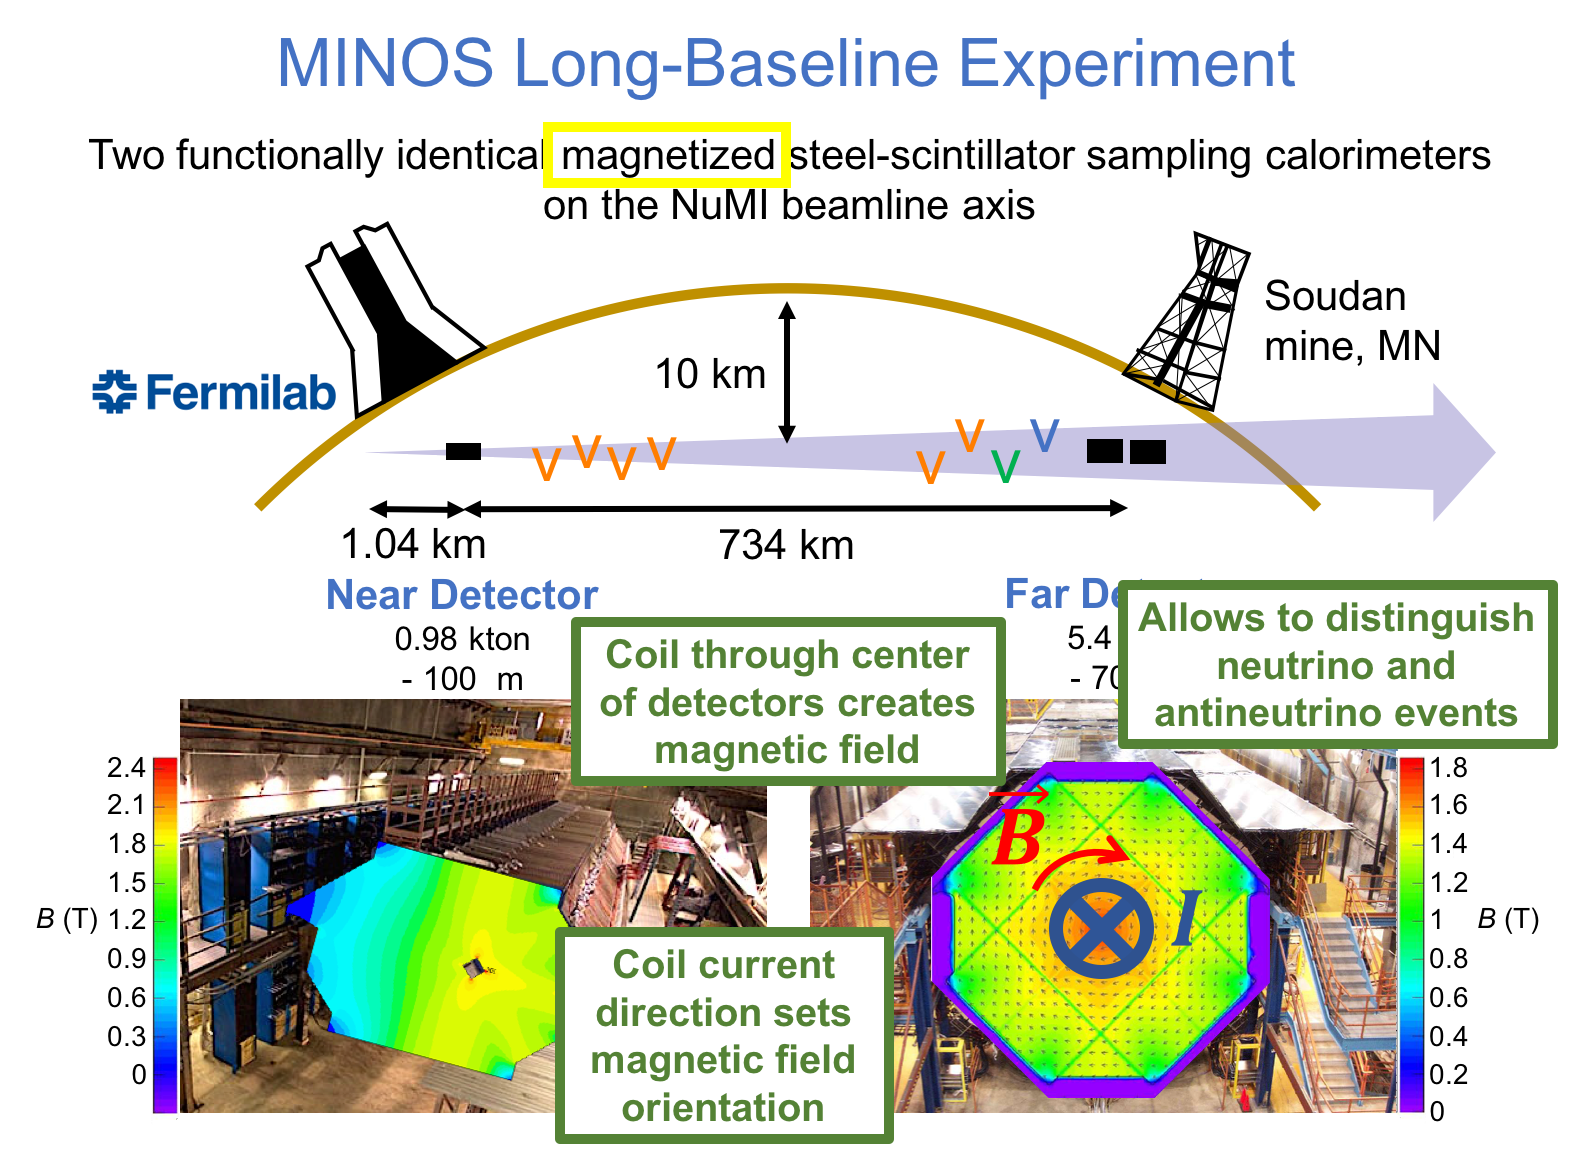
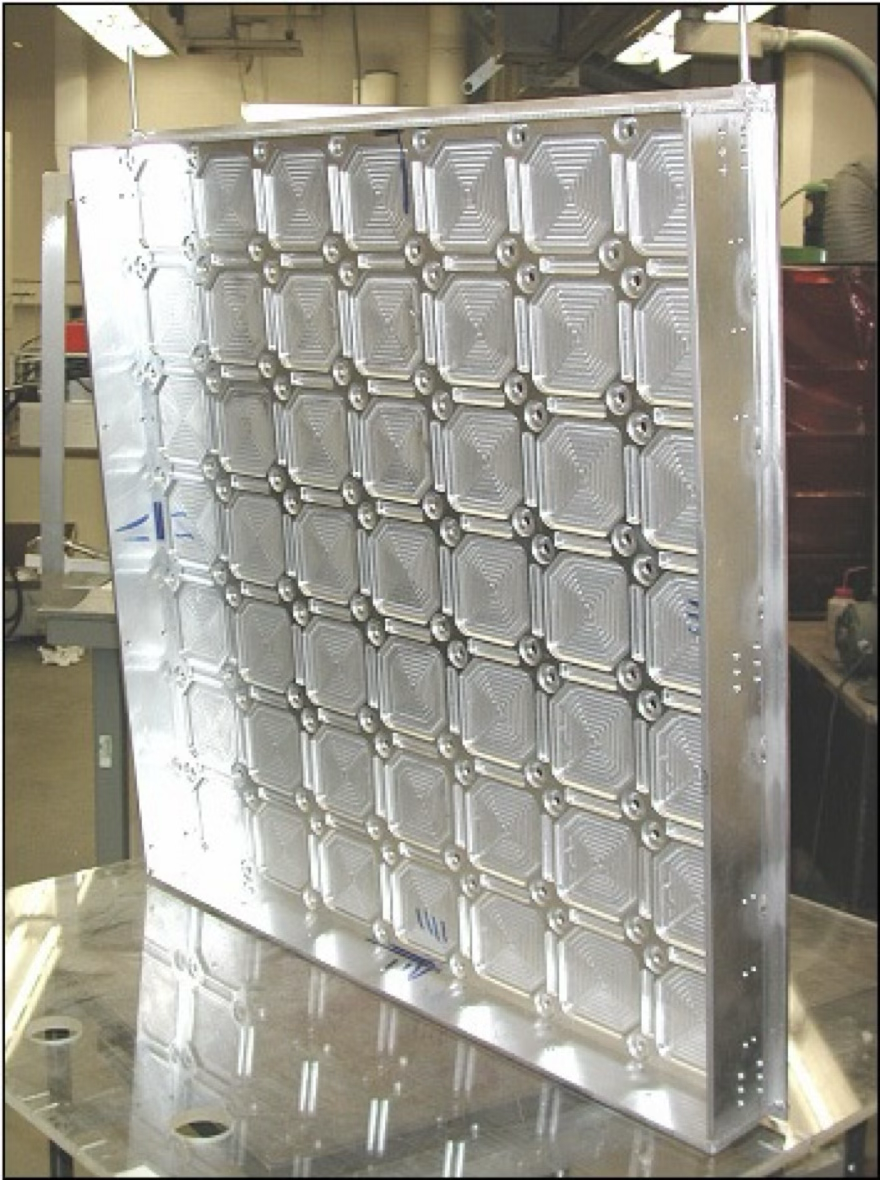
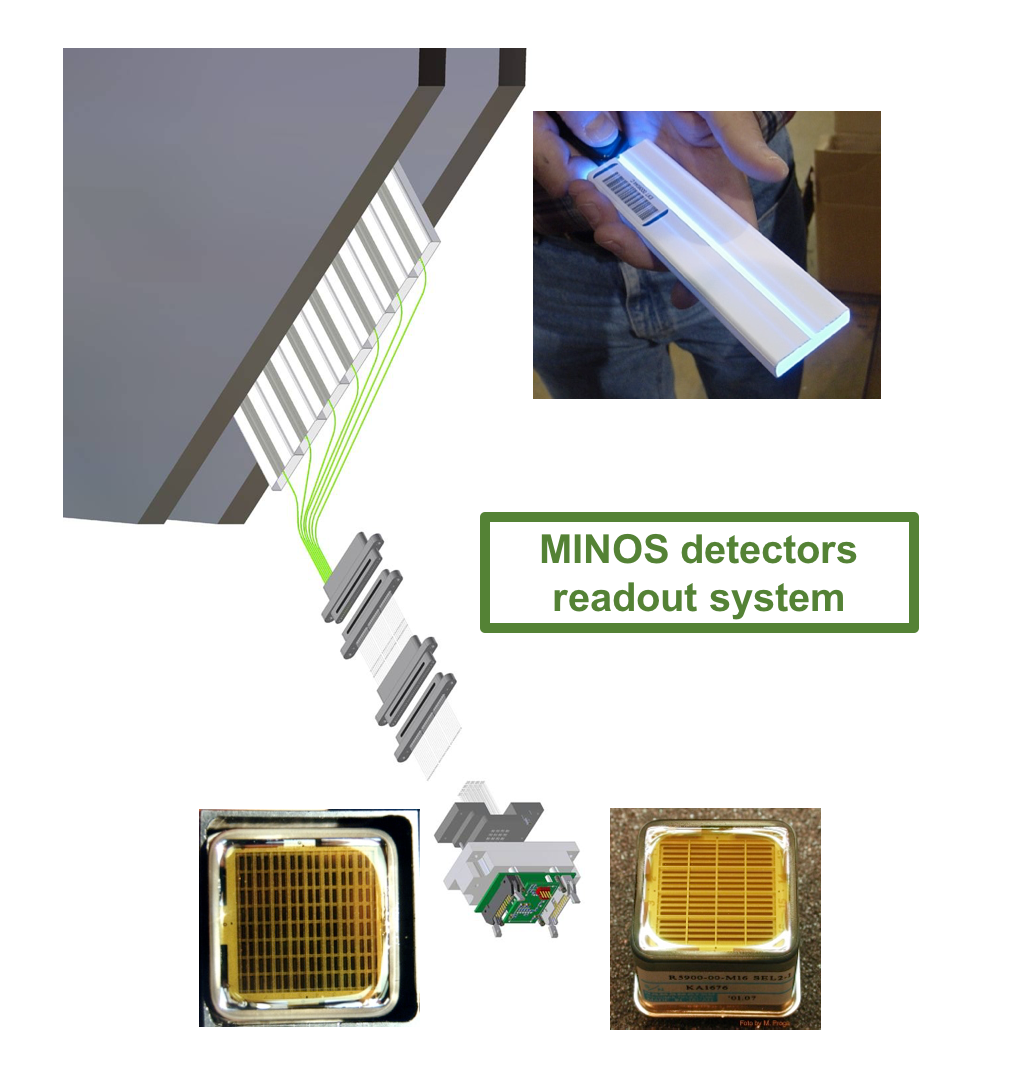
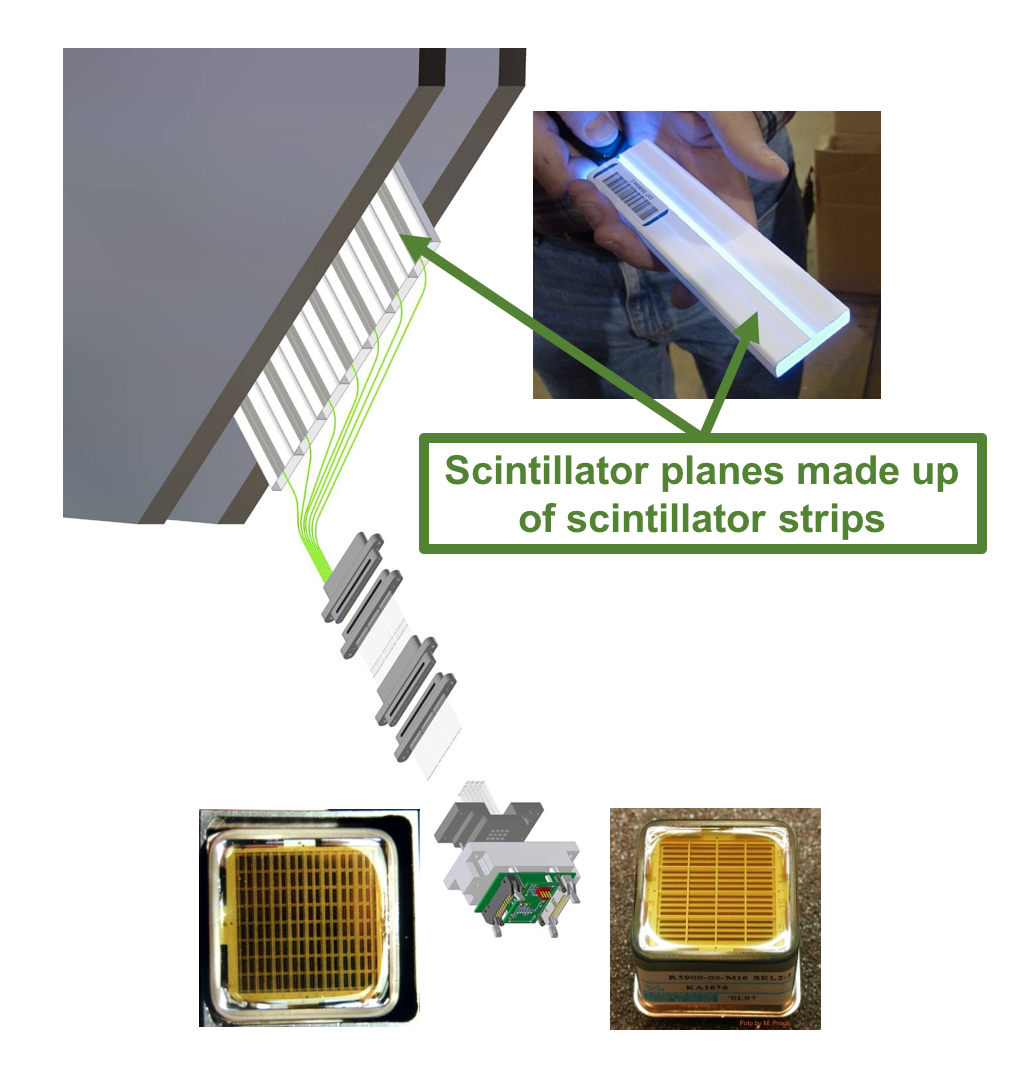
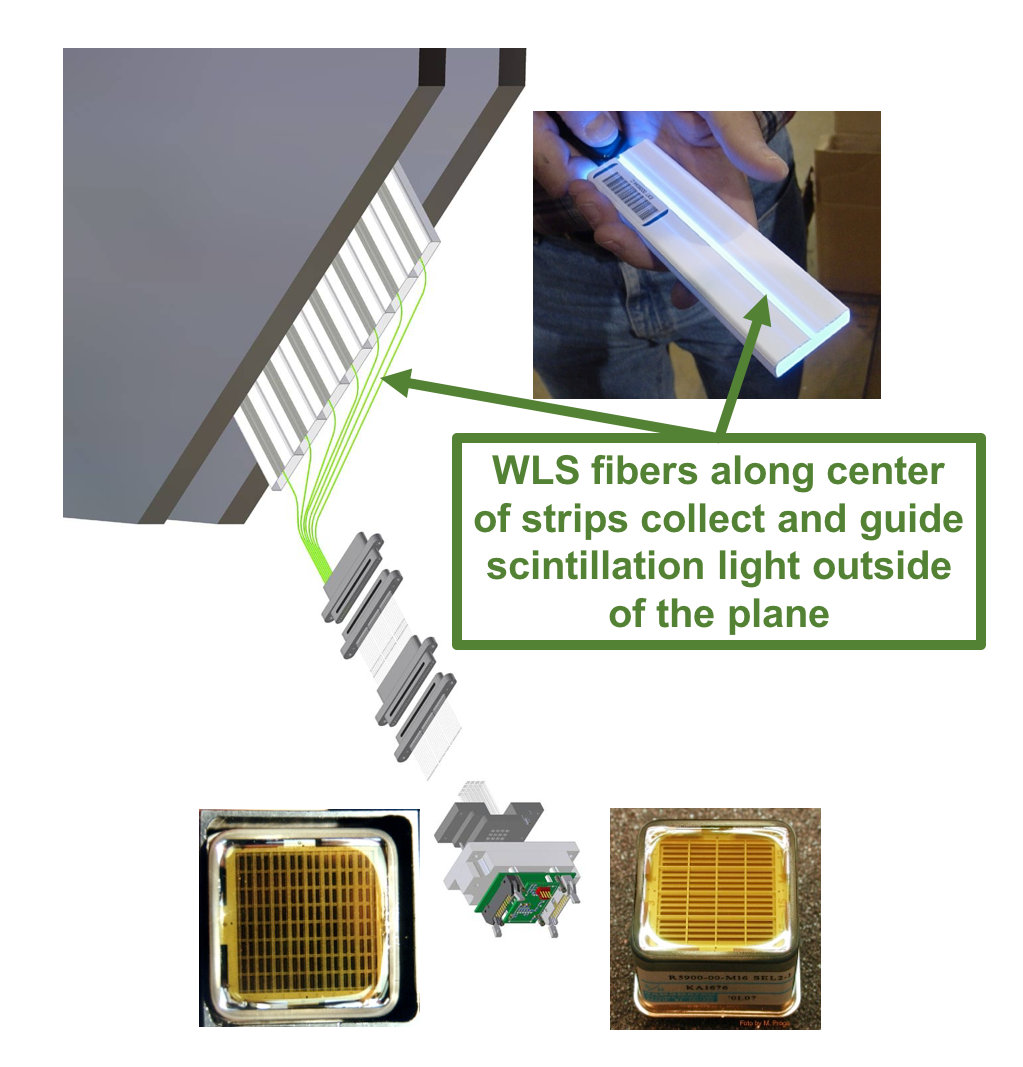
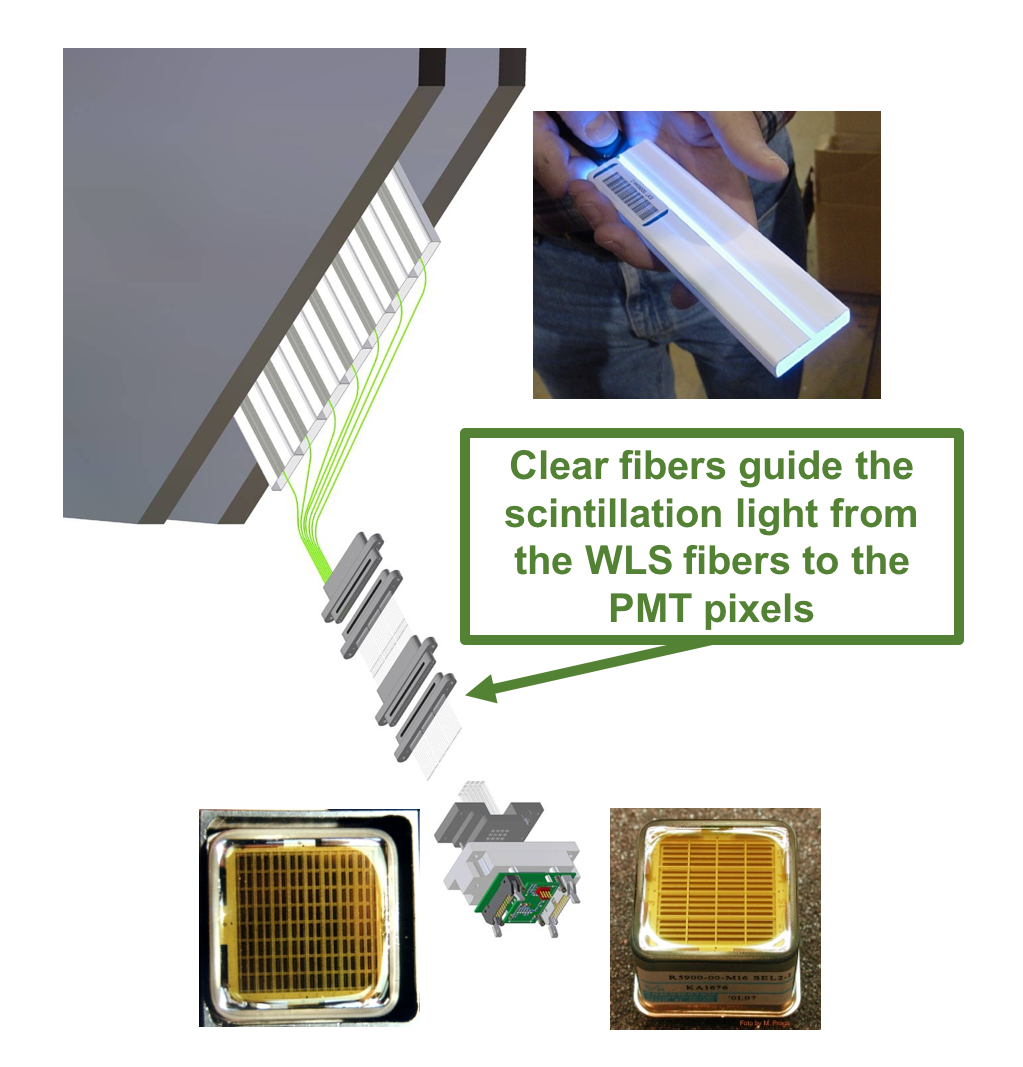
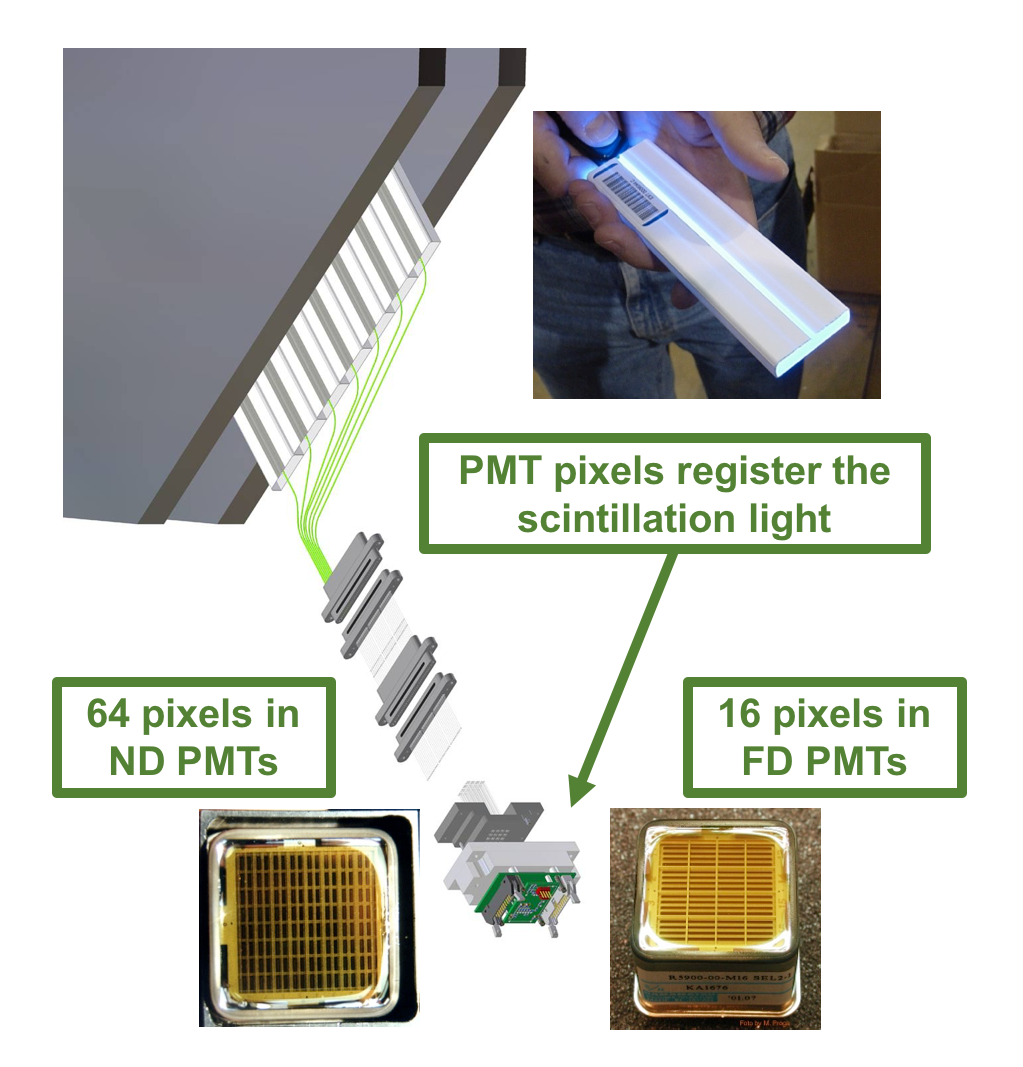
Figure 2: Flip through the images, by clicking on the left or the right of each figure or using the indicator located on top, to learn more about the MINOS readout system.
The NuMI beam is produced by colliding 120GeV protons into a graphite target. The resulting pions and kaons are then focused by two magnetic horns into a decay pipe, where they decay into muon (anti)neutrinos. The magnetic horns allow the beam to be operated in either a or mode, as shown in Fig. 3. In June 2016 the NuMI beam achieved a beam power of 700kW making it the most powerful neutrino beamline, currently used for the NOA experiment (see below).
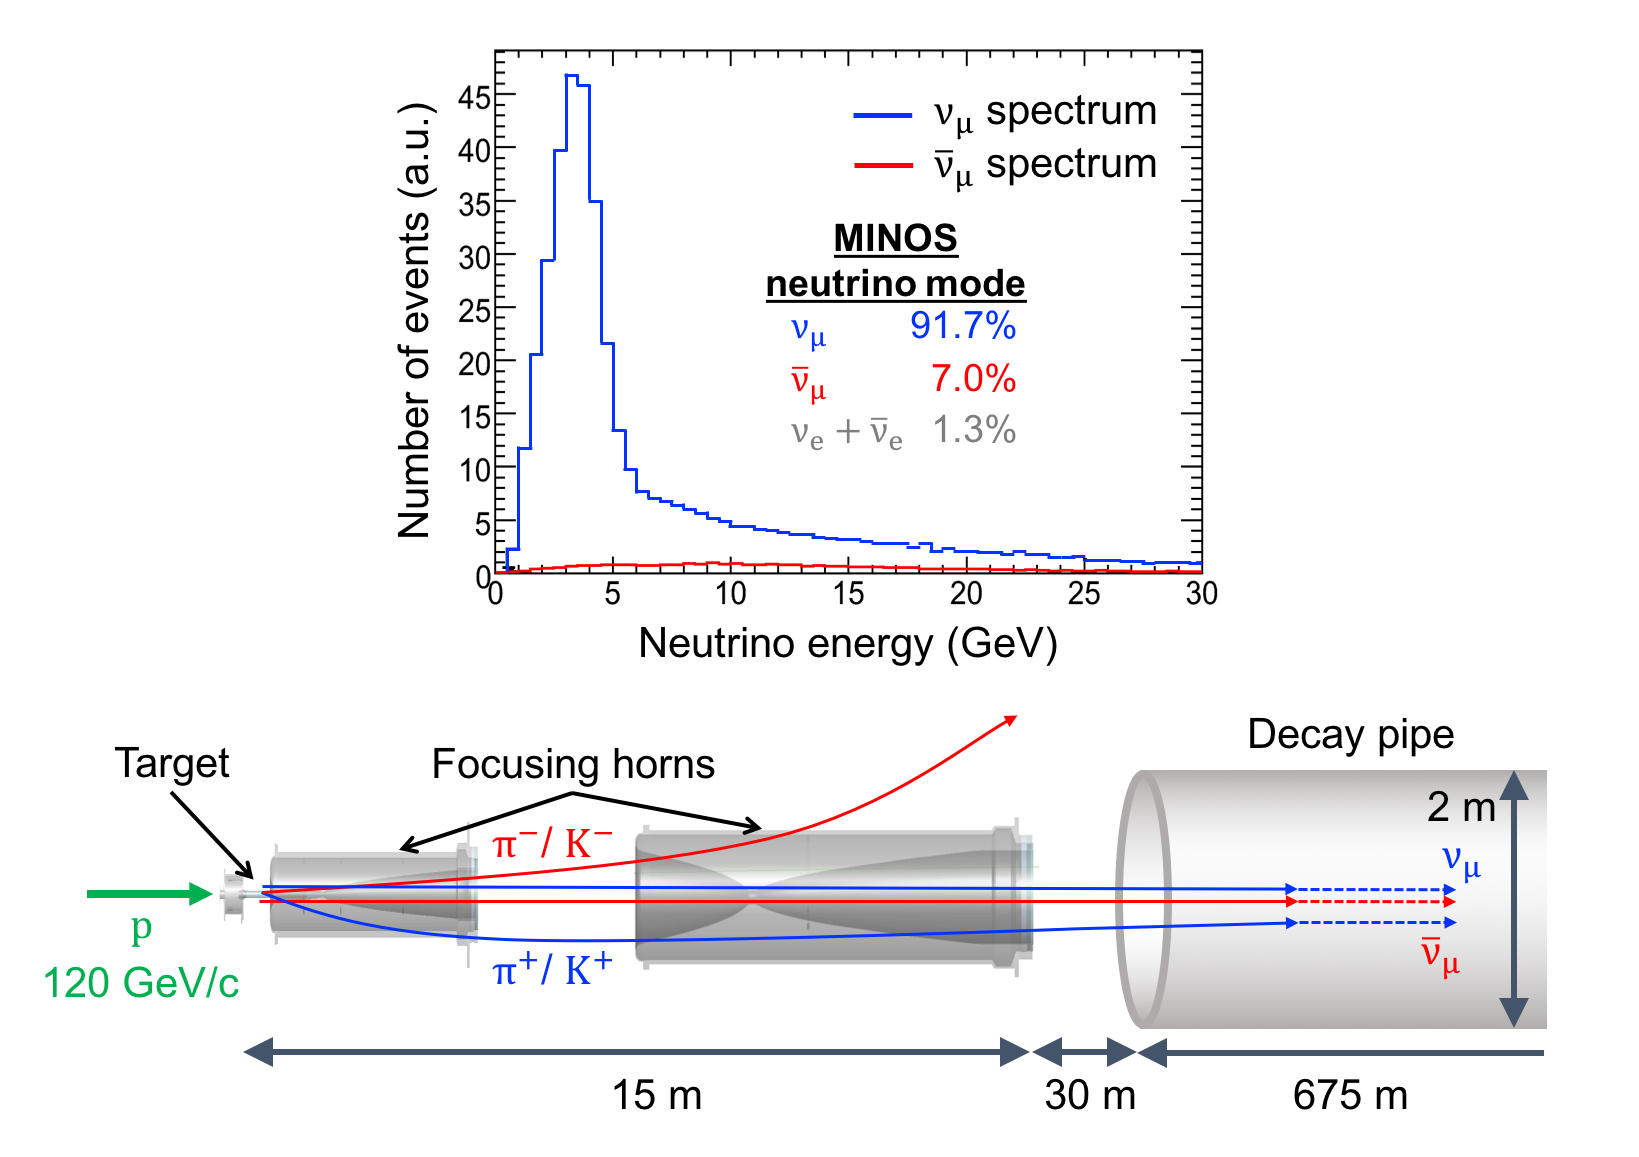
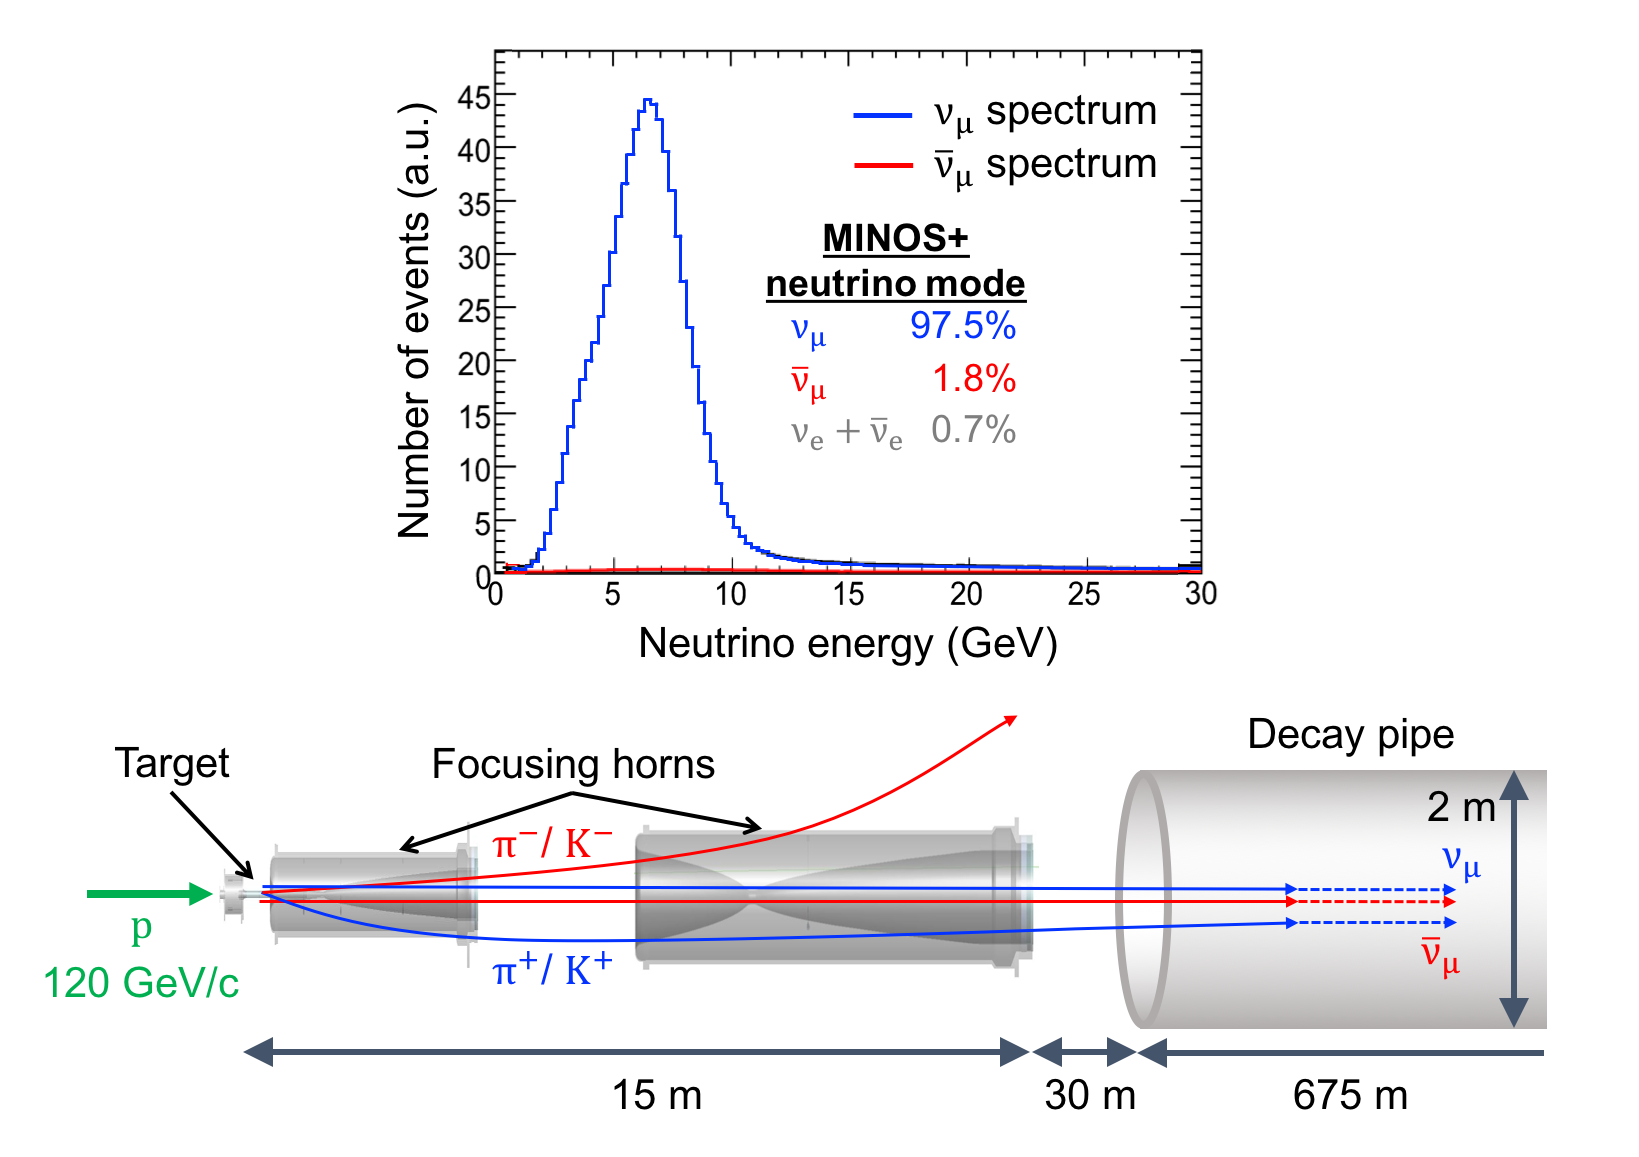
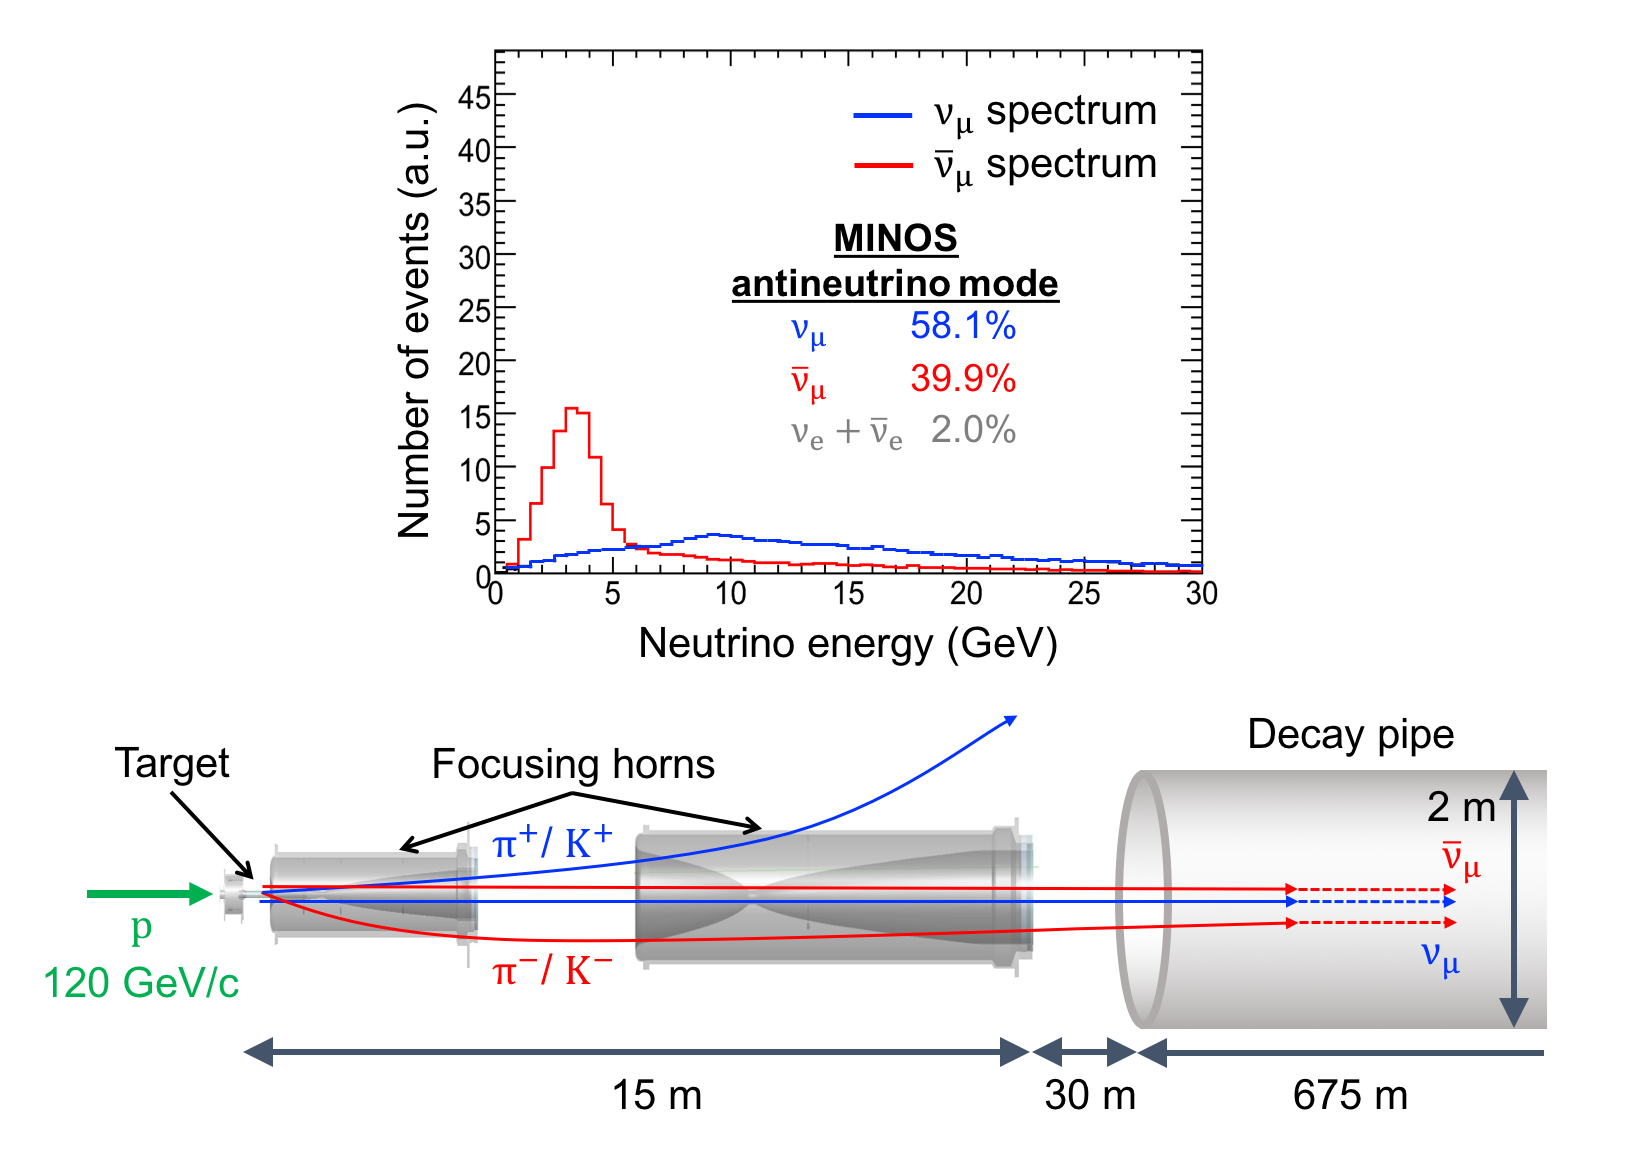
Figure 3: Creating a muon neutrino or antineutrino beam with NuMI. Positive and negative pions and kaons resulting from protons interacting with the NuMI target are either focused or defocused by the magnetic horns, depending on the direction of the current running through the horns. When positive pions and kaons are focused into the decay pipe, their decays lead to a neutrino beam dominated by muon neutrinos (first figure for MINOS and second figure for MINOS+). Focusing negative pions and kaons leads to a neutrino beam dominated by muon antineutrinos (third figure).
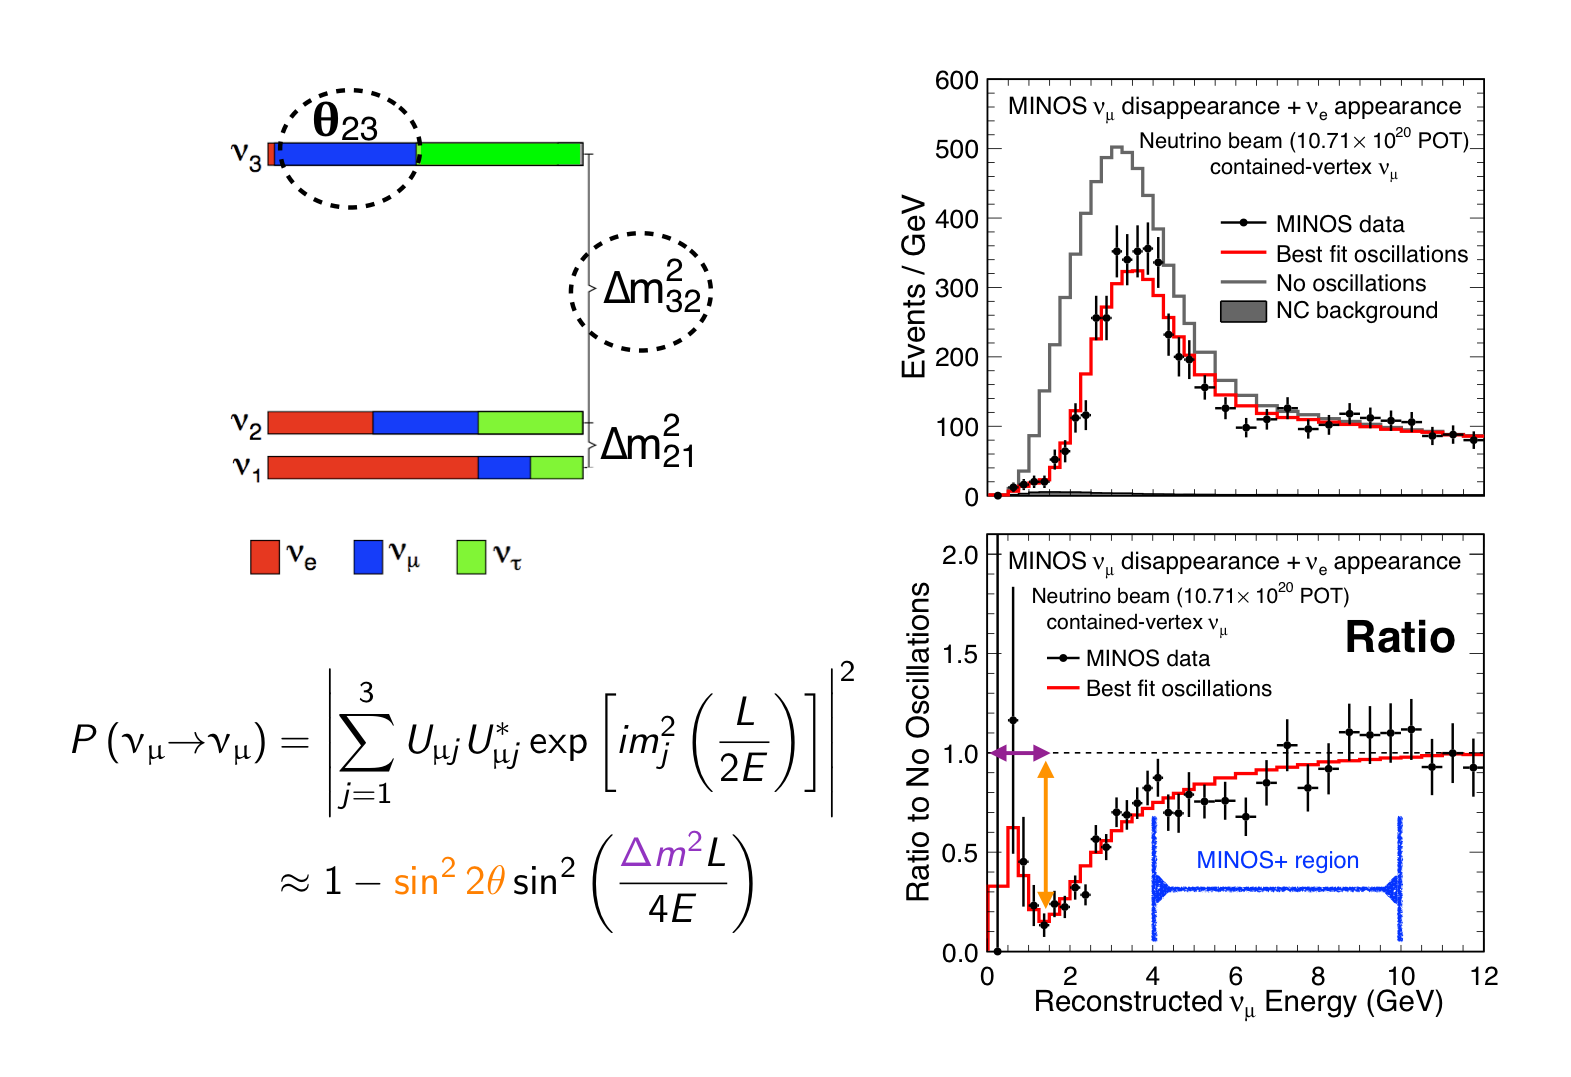
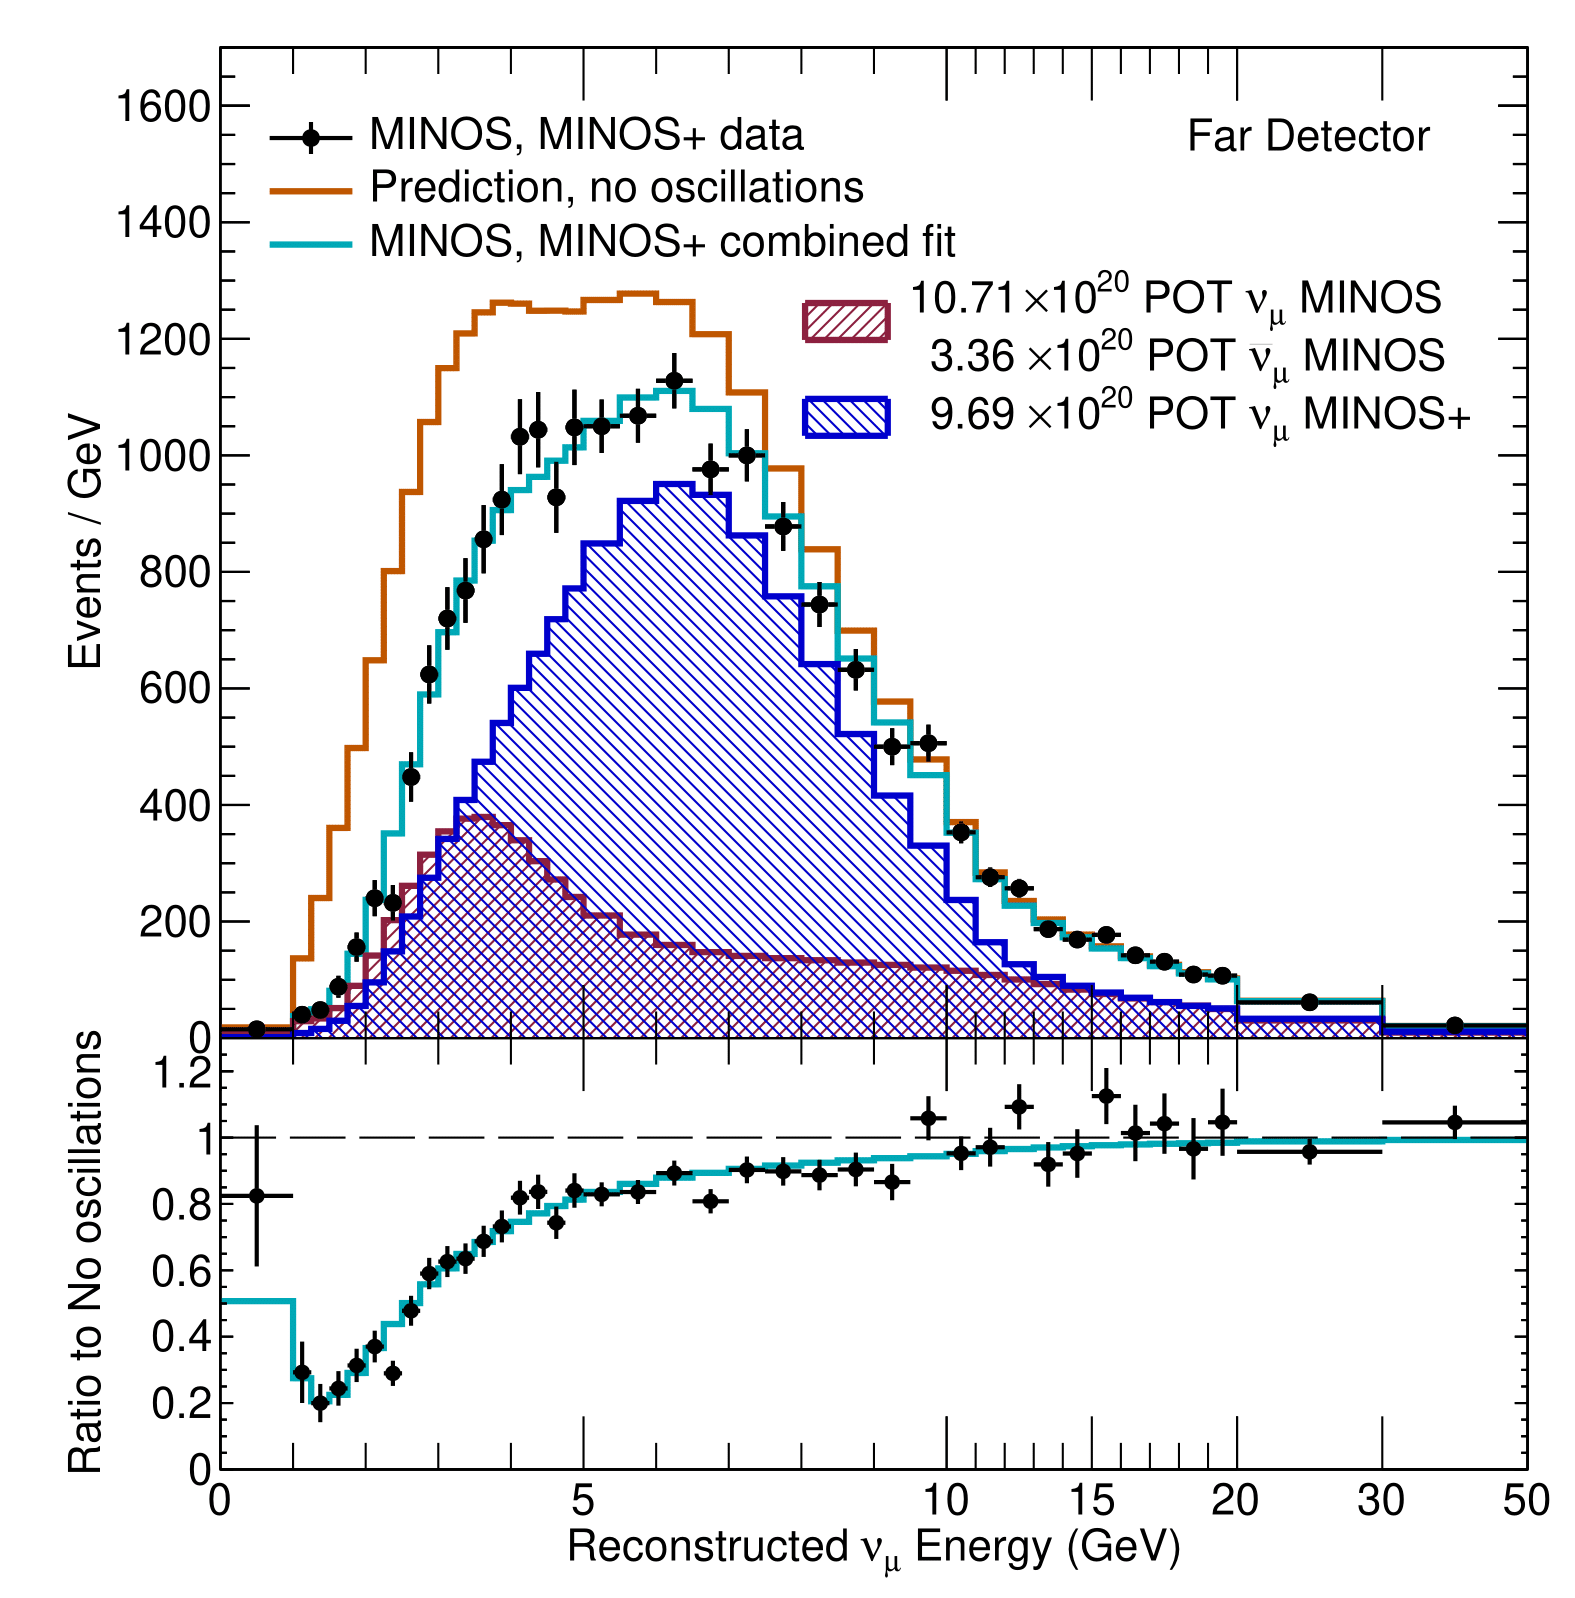
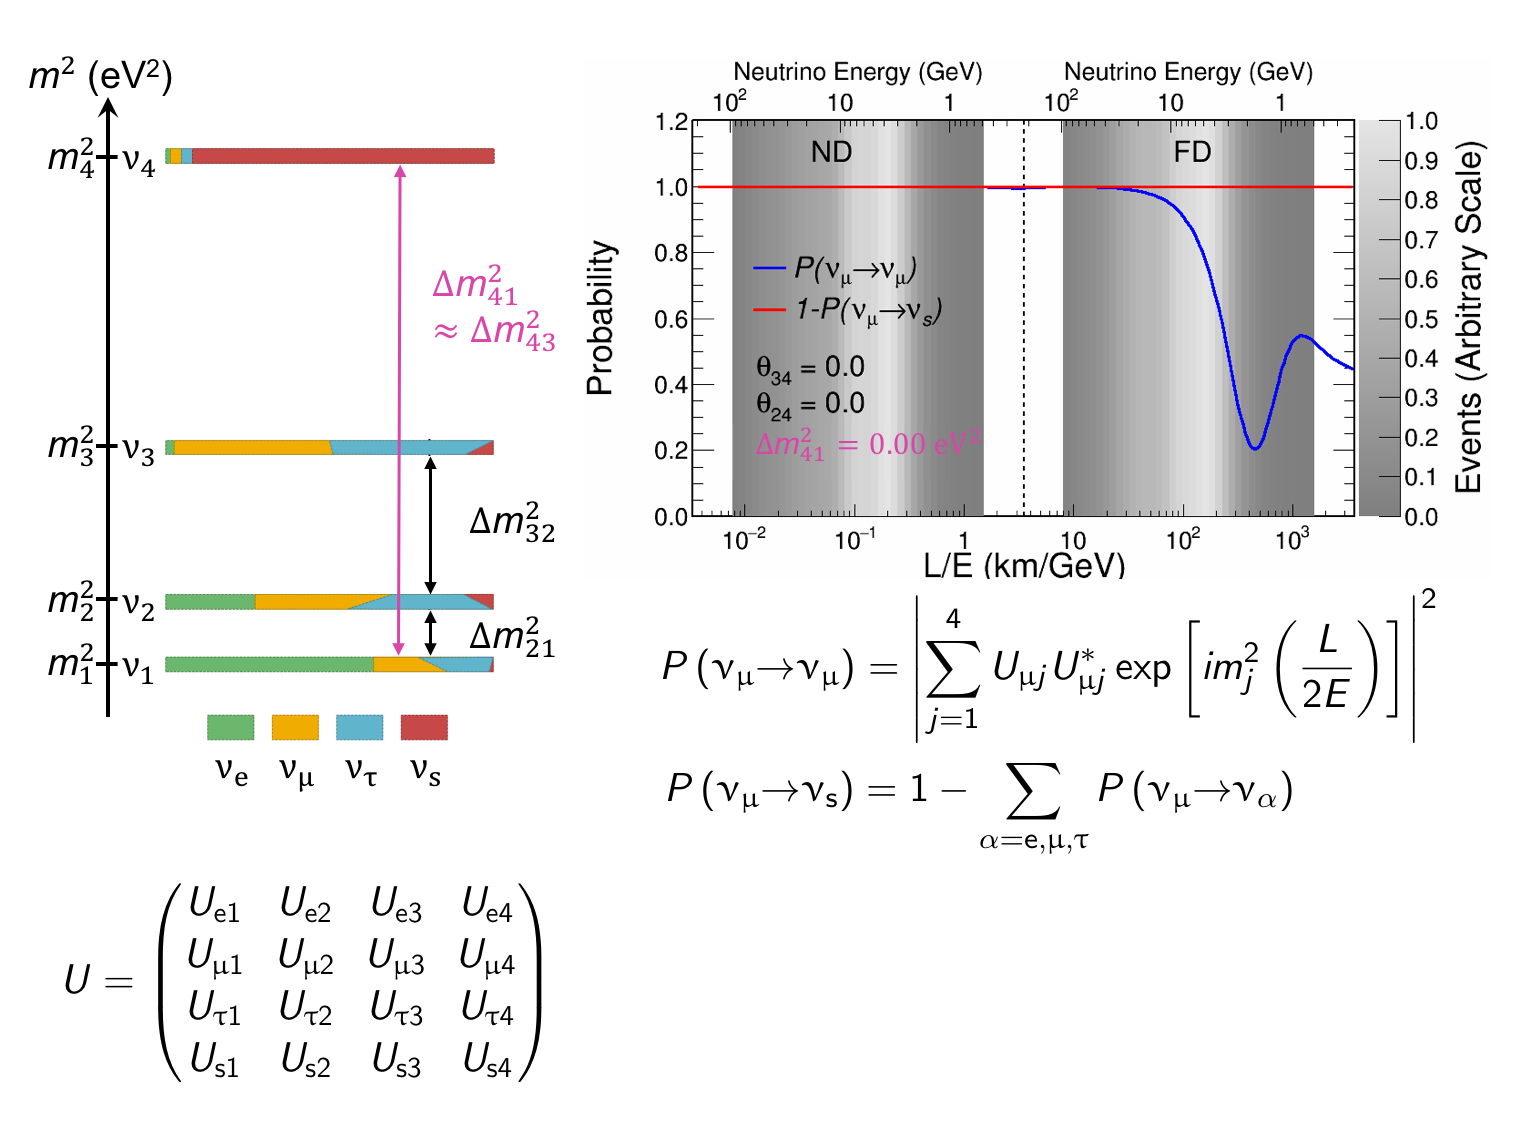
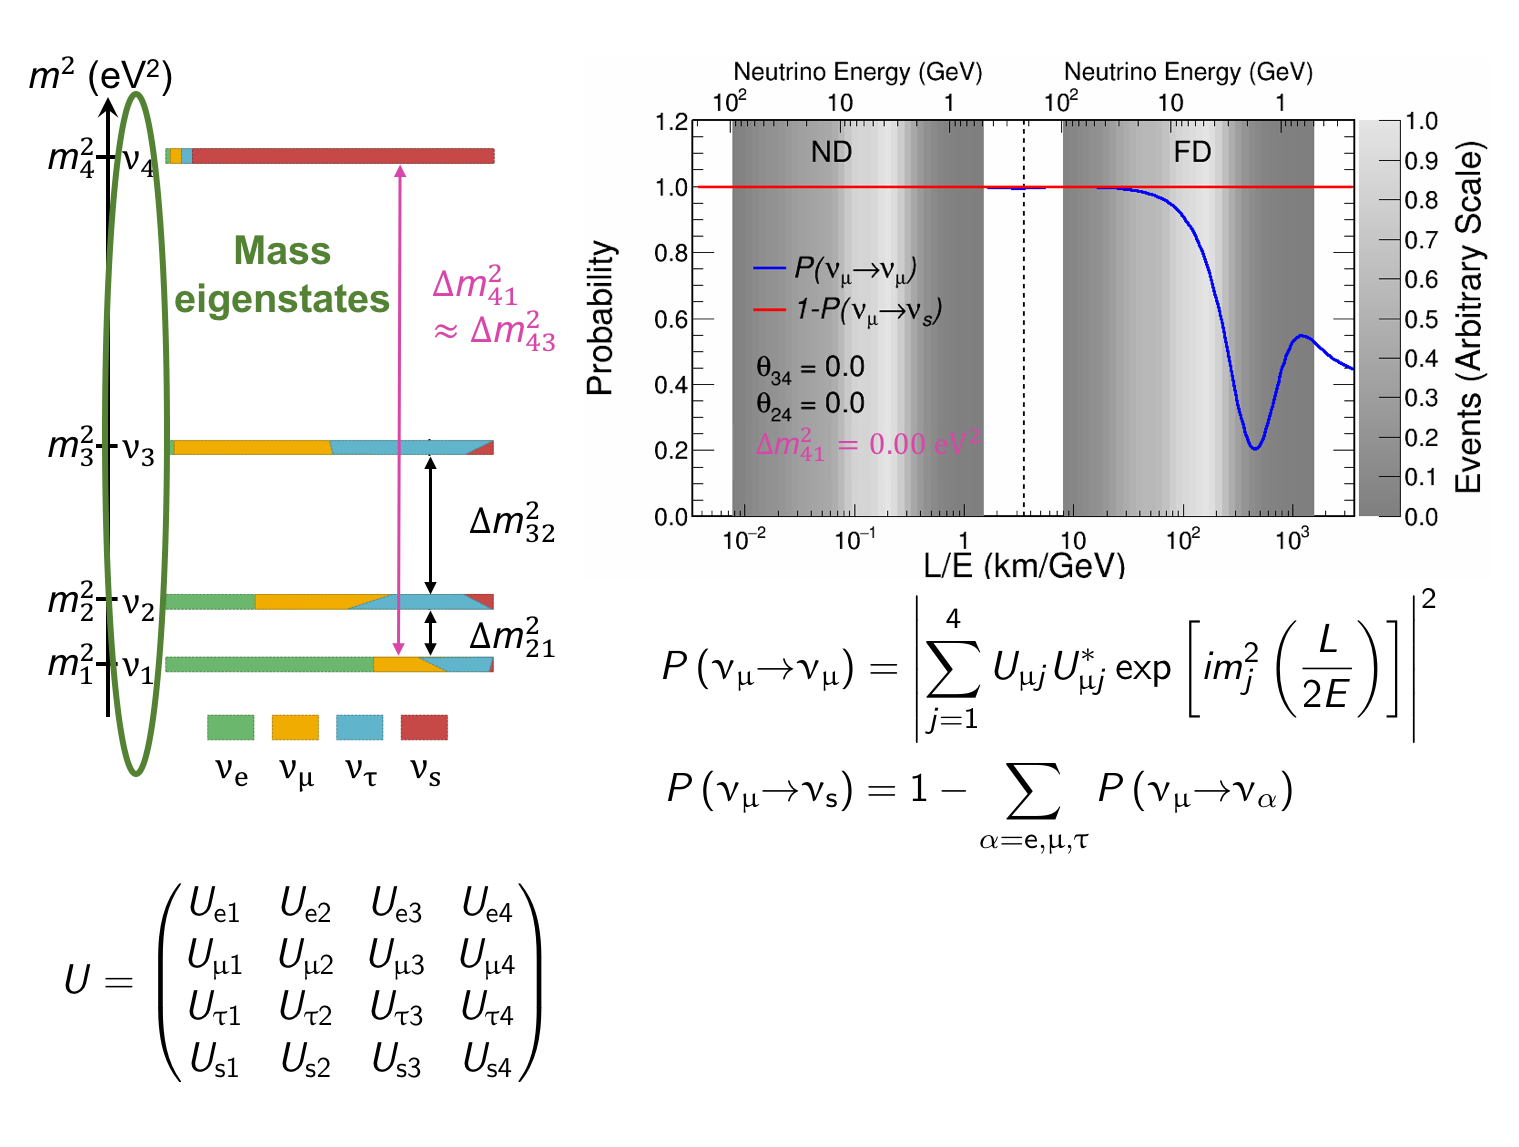
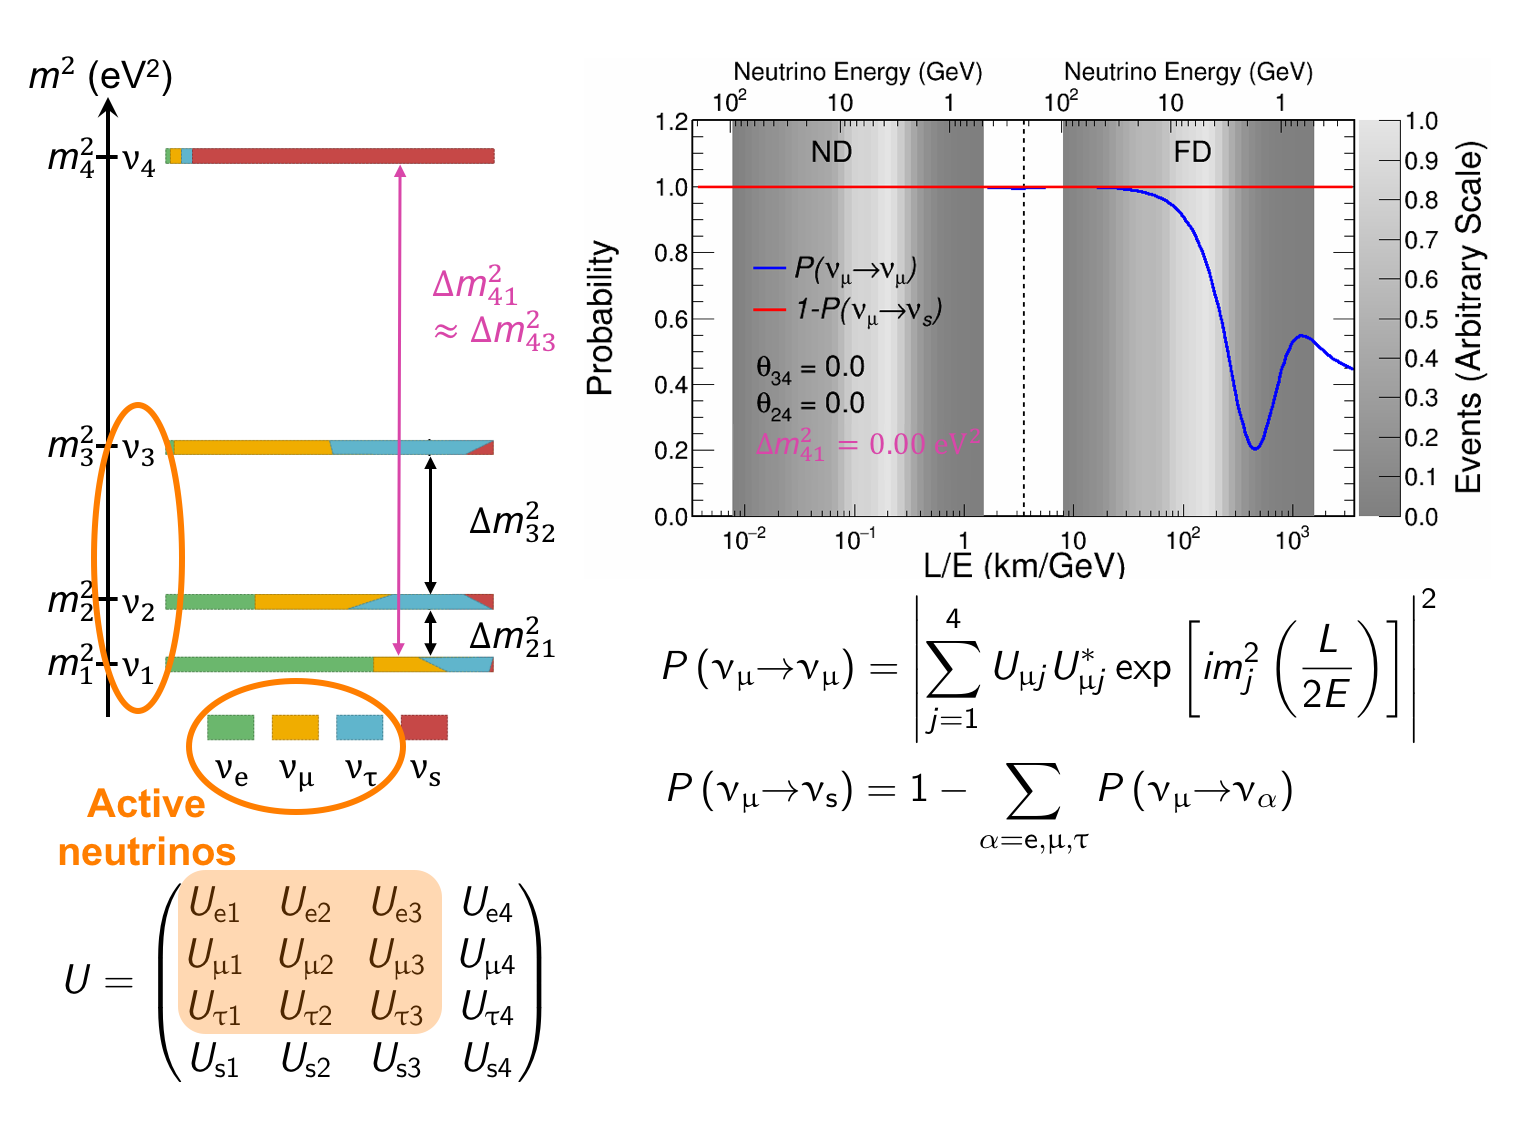
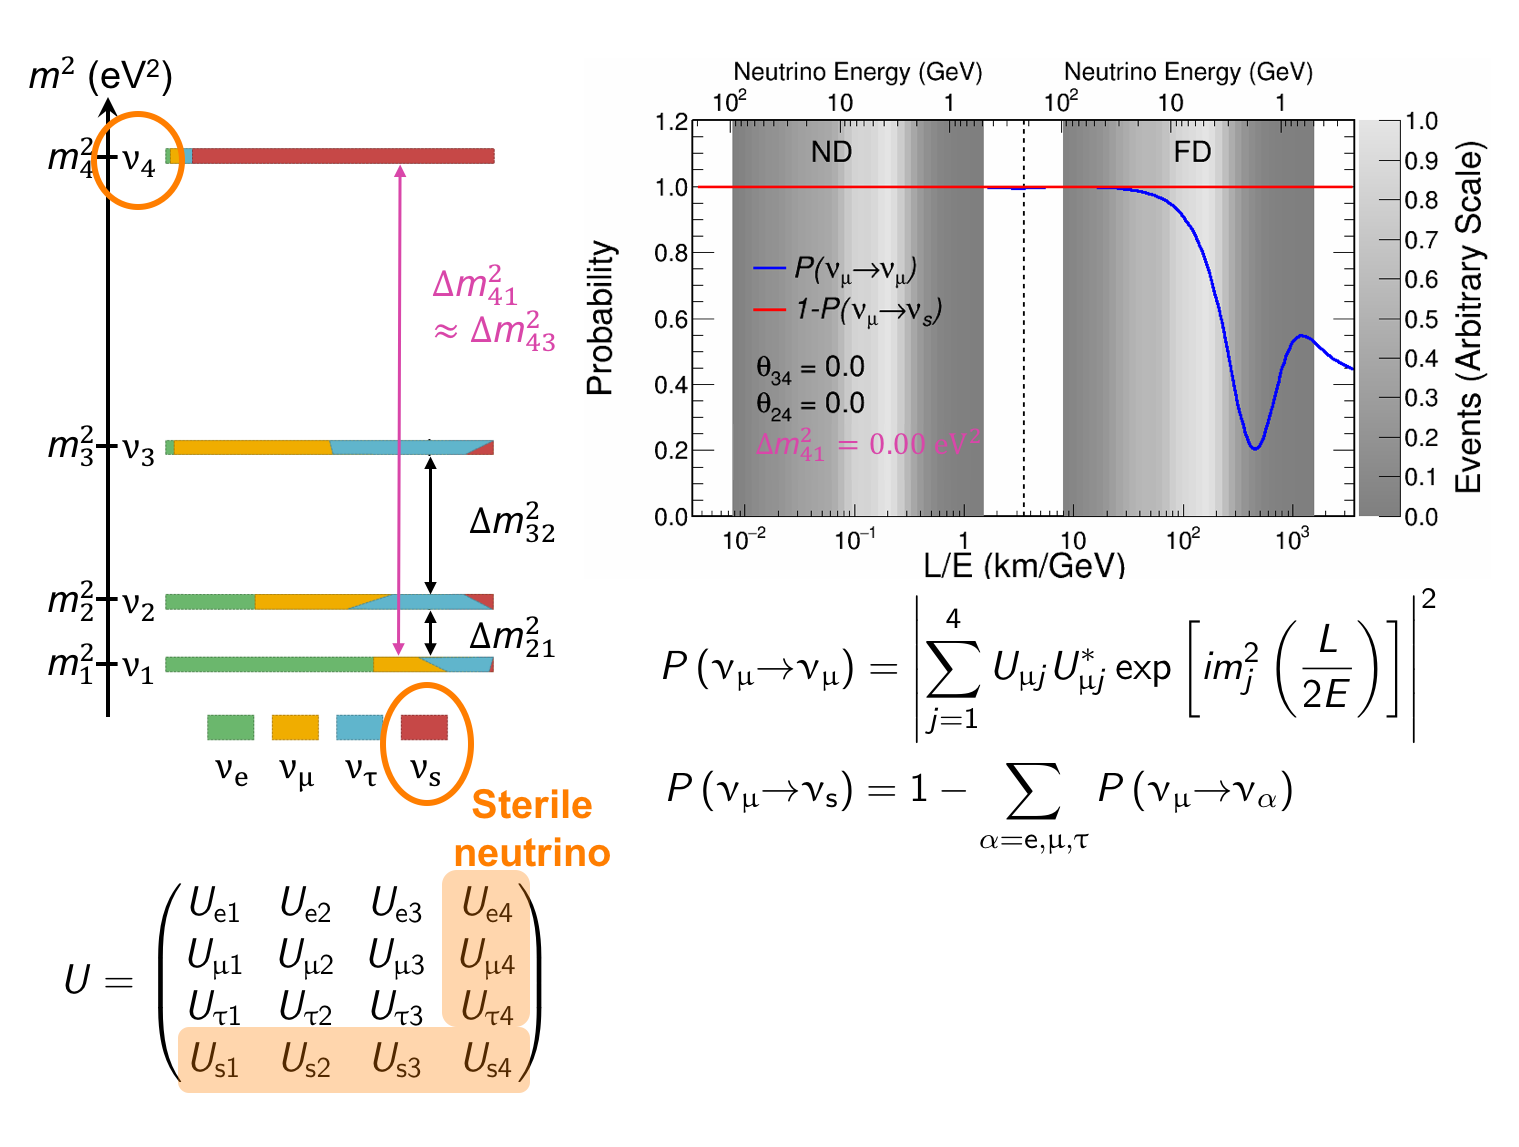
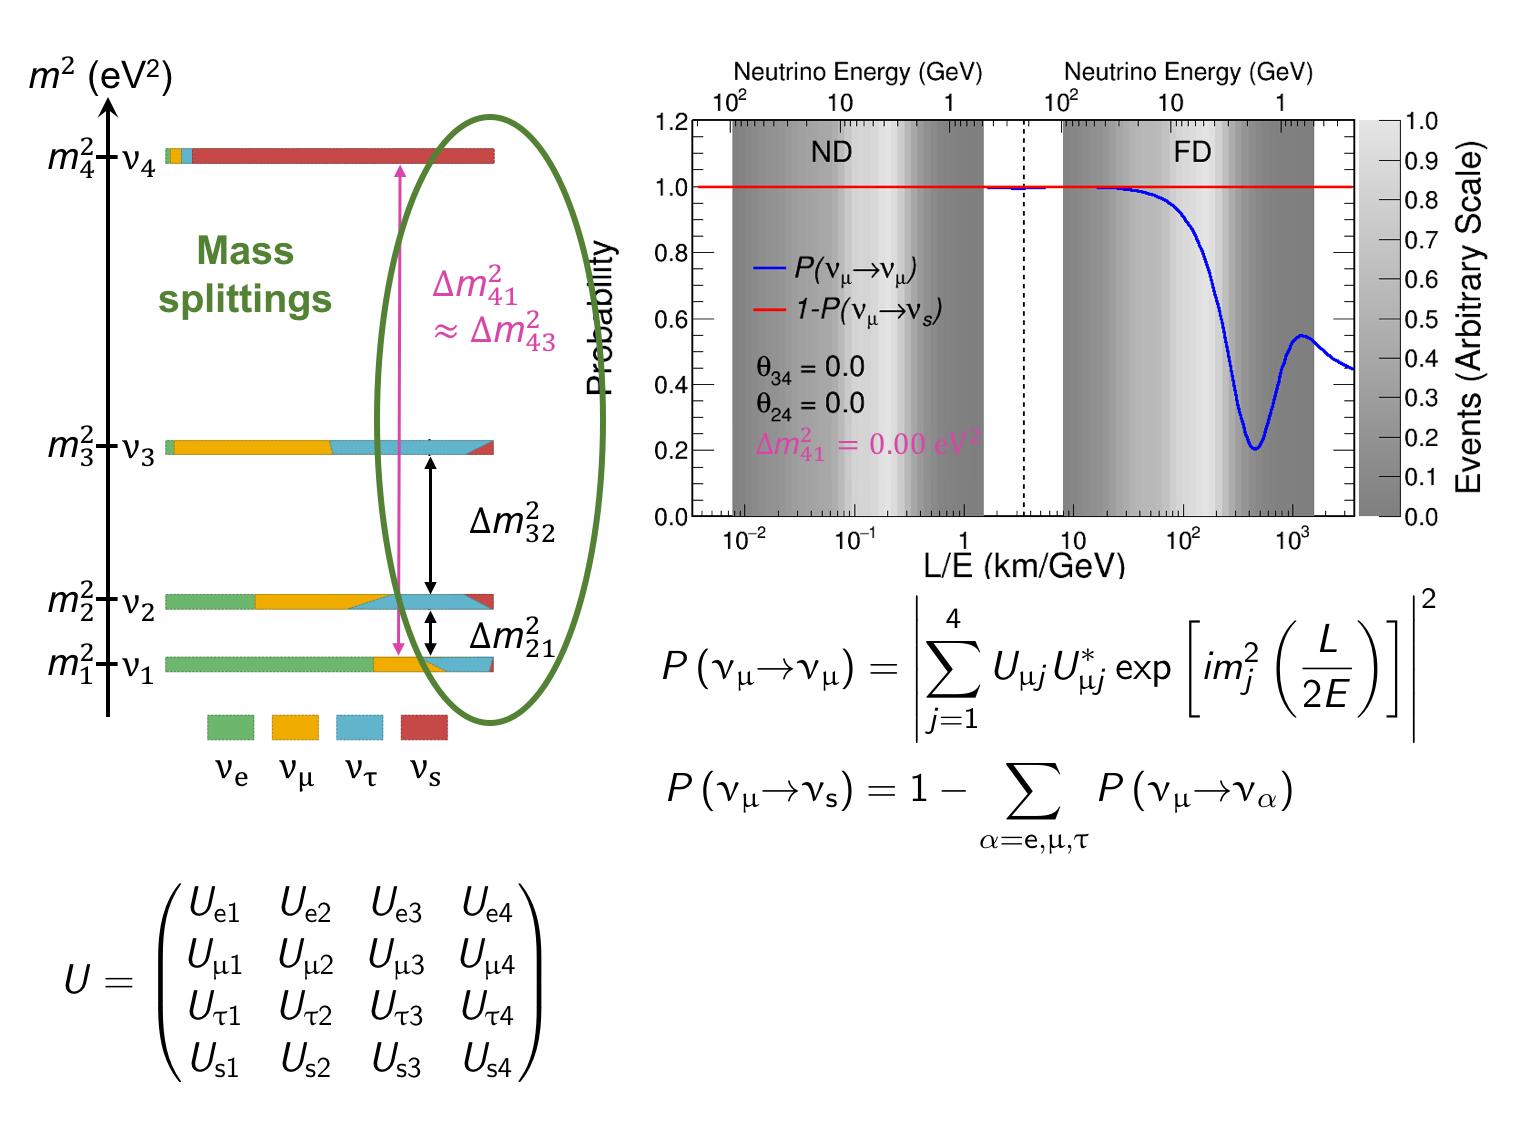
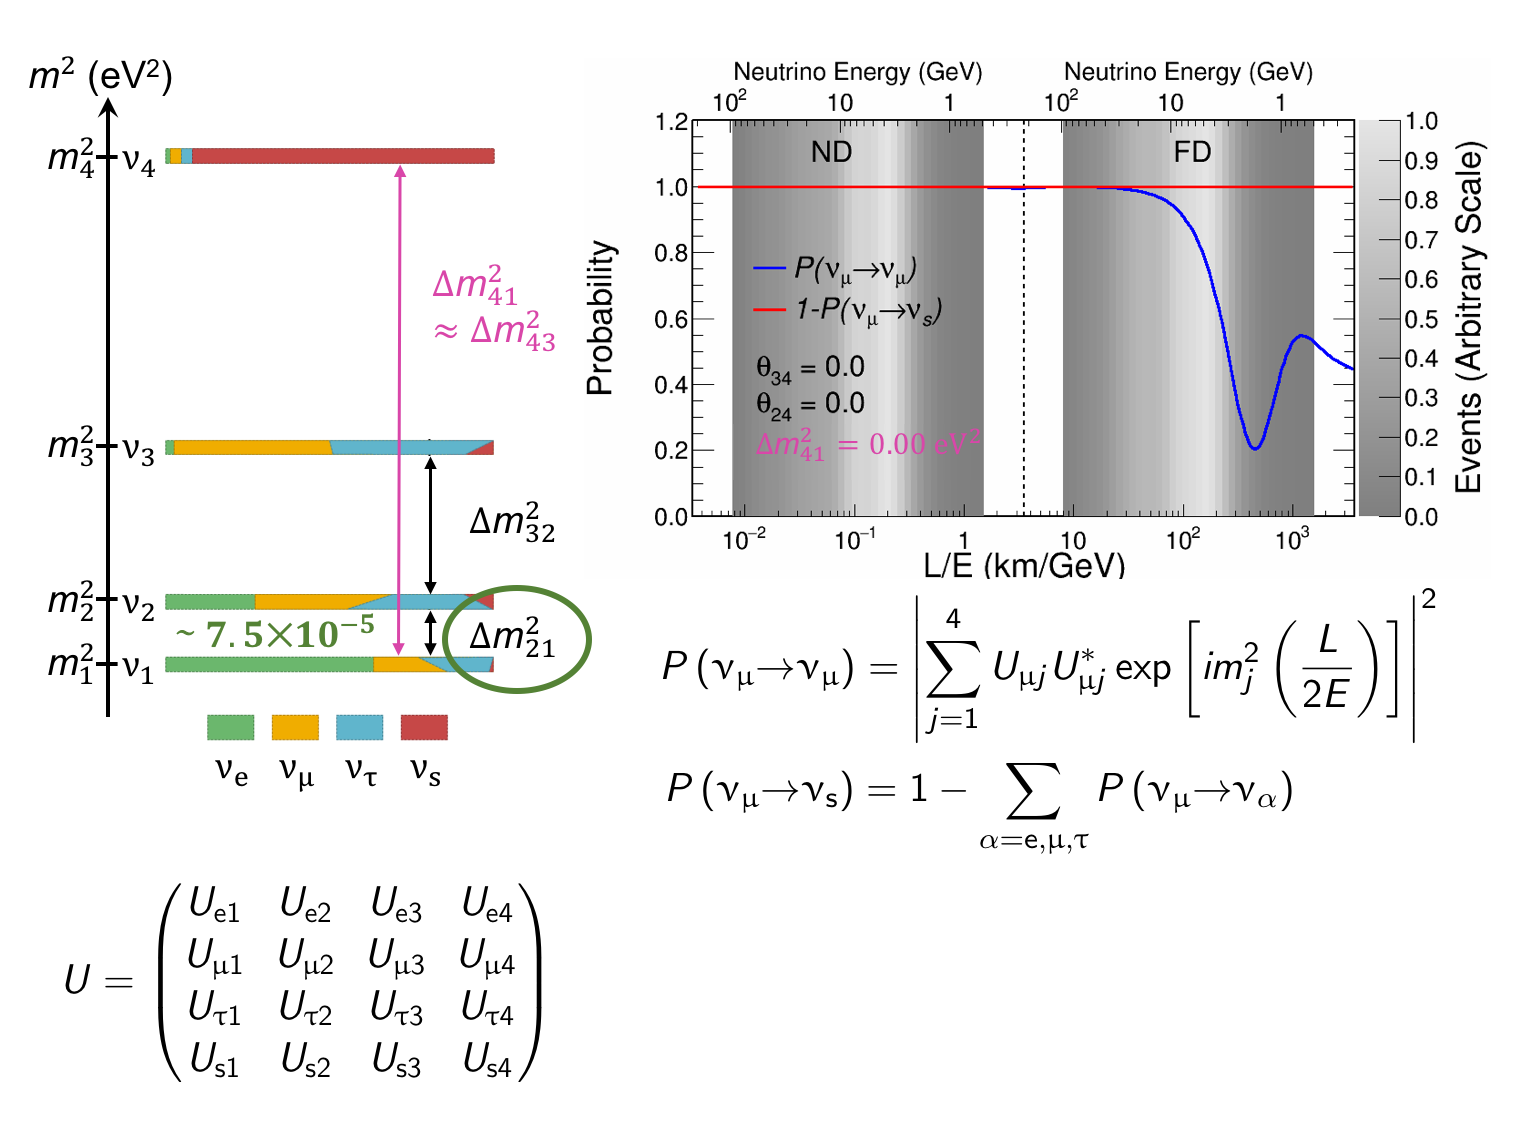
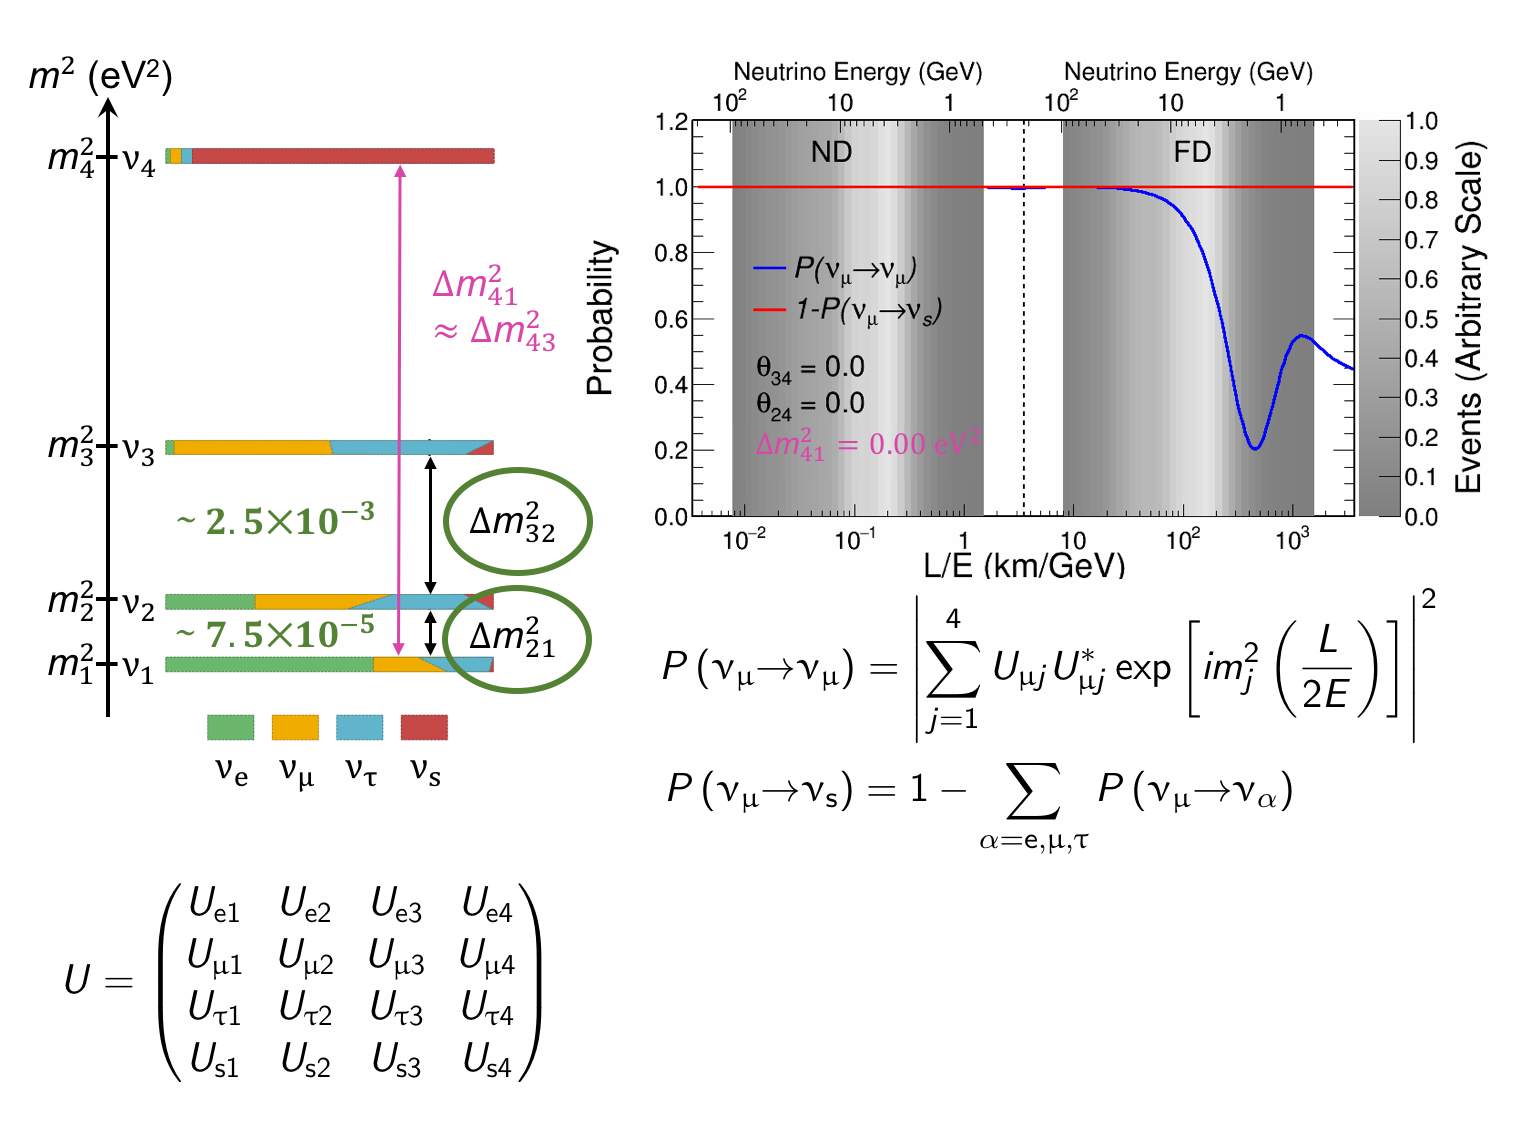
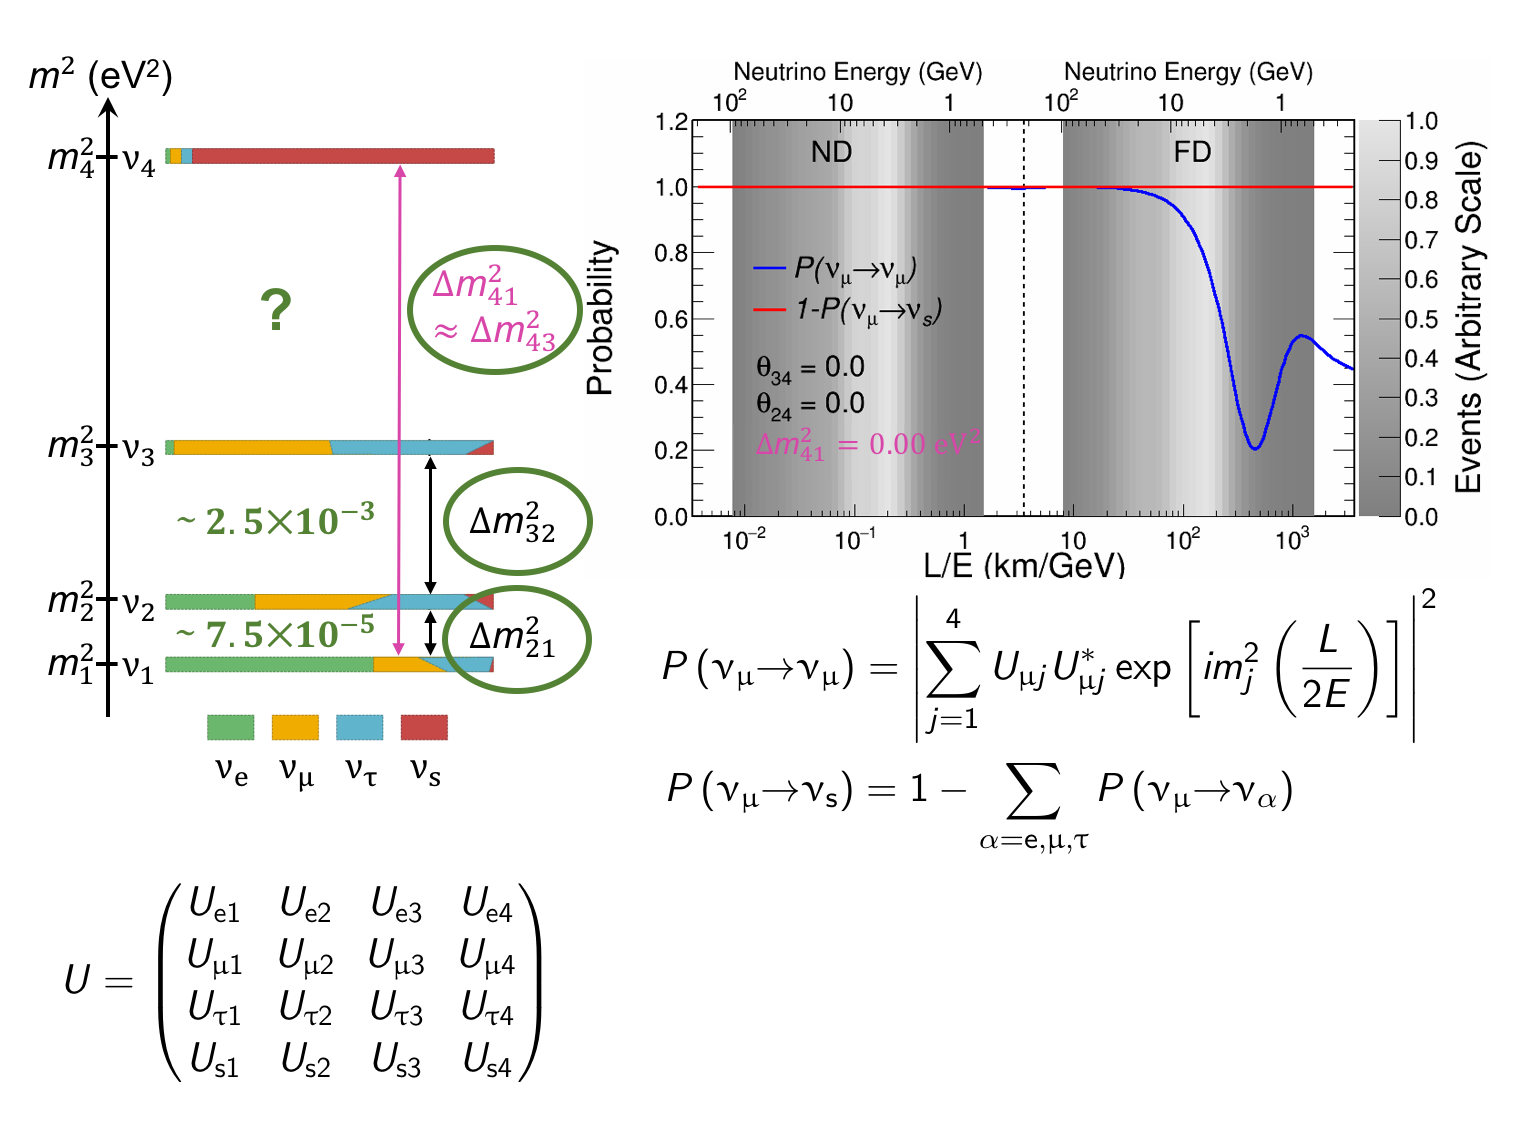
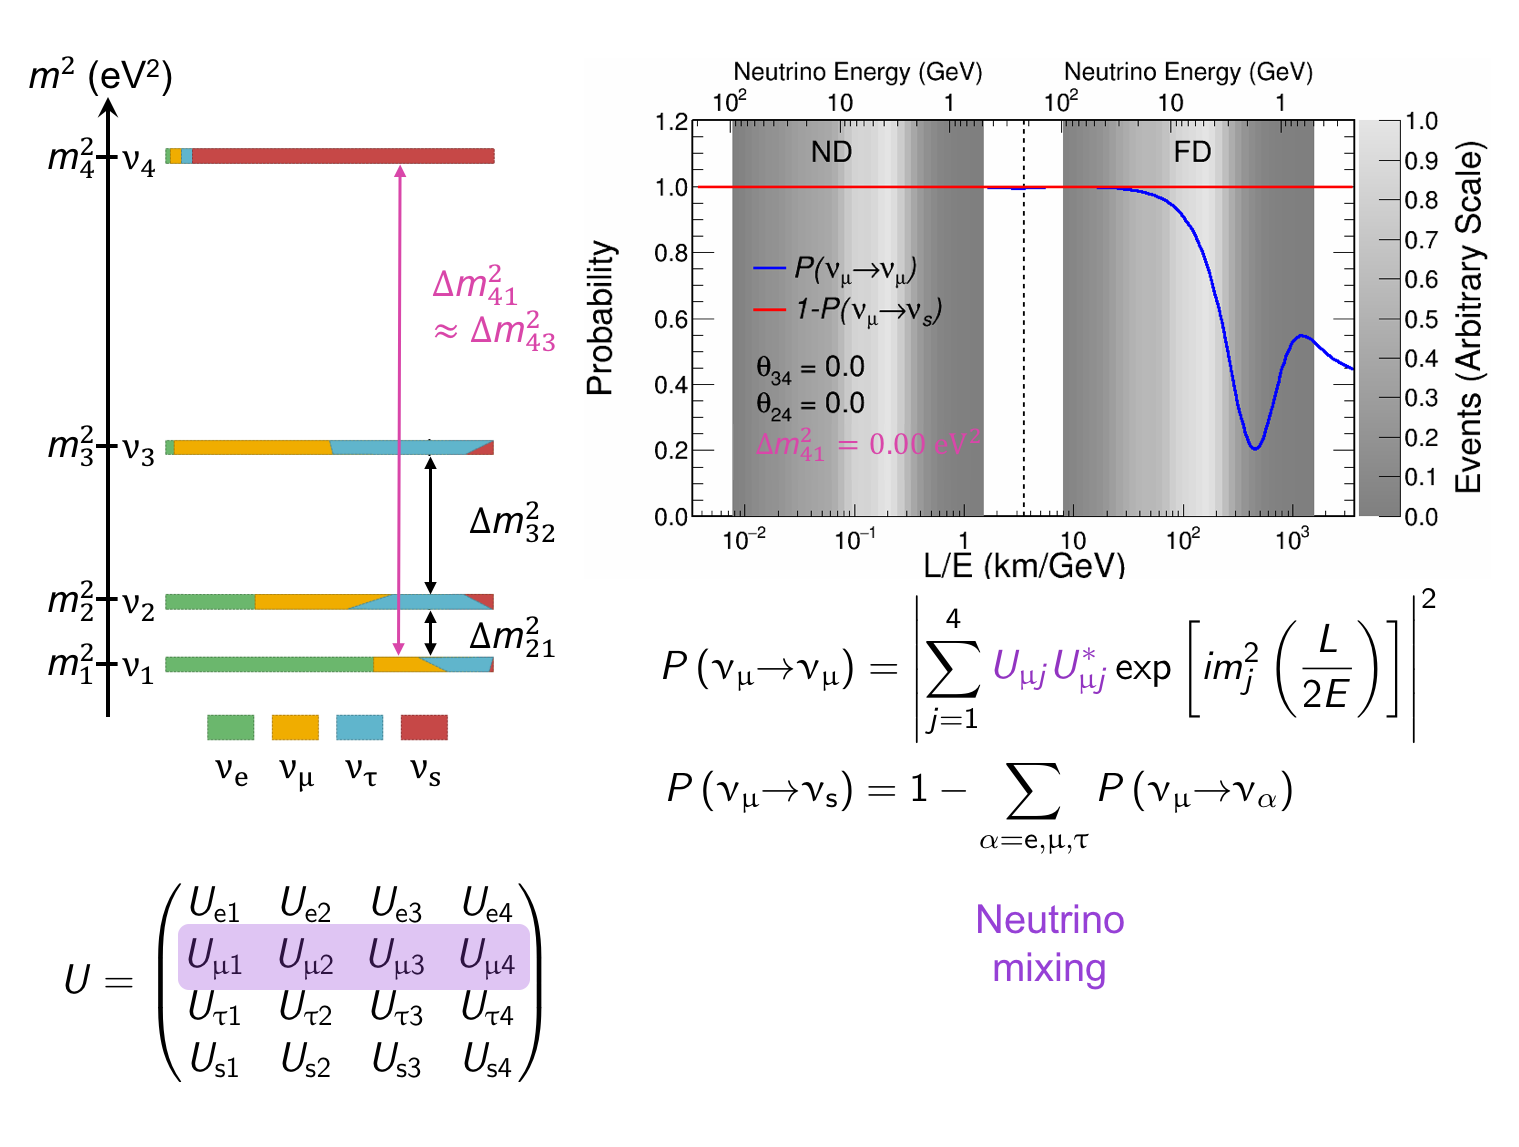
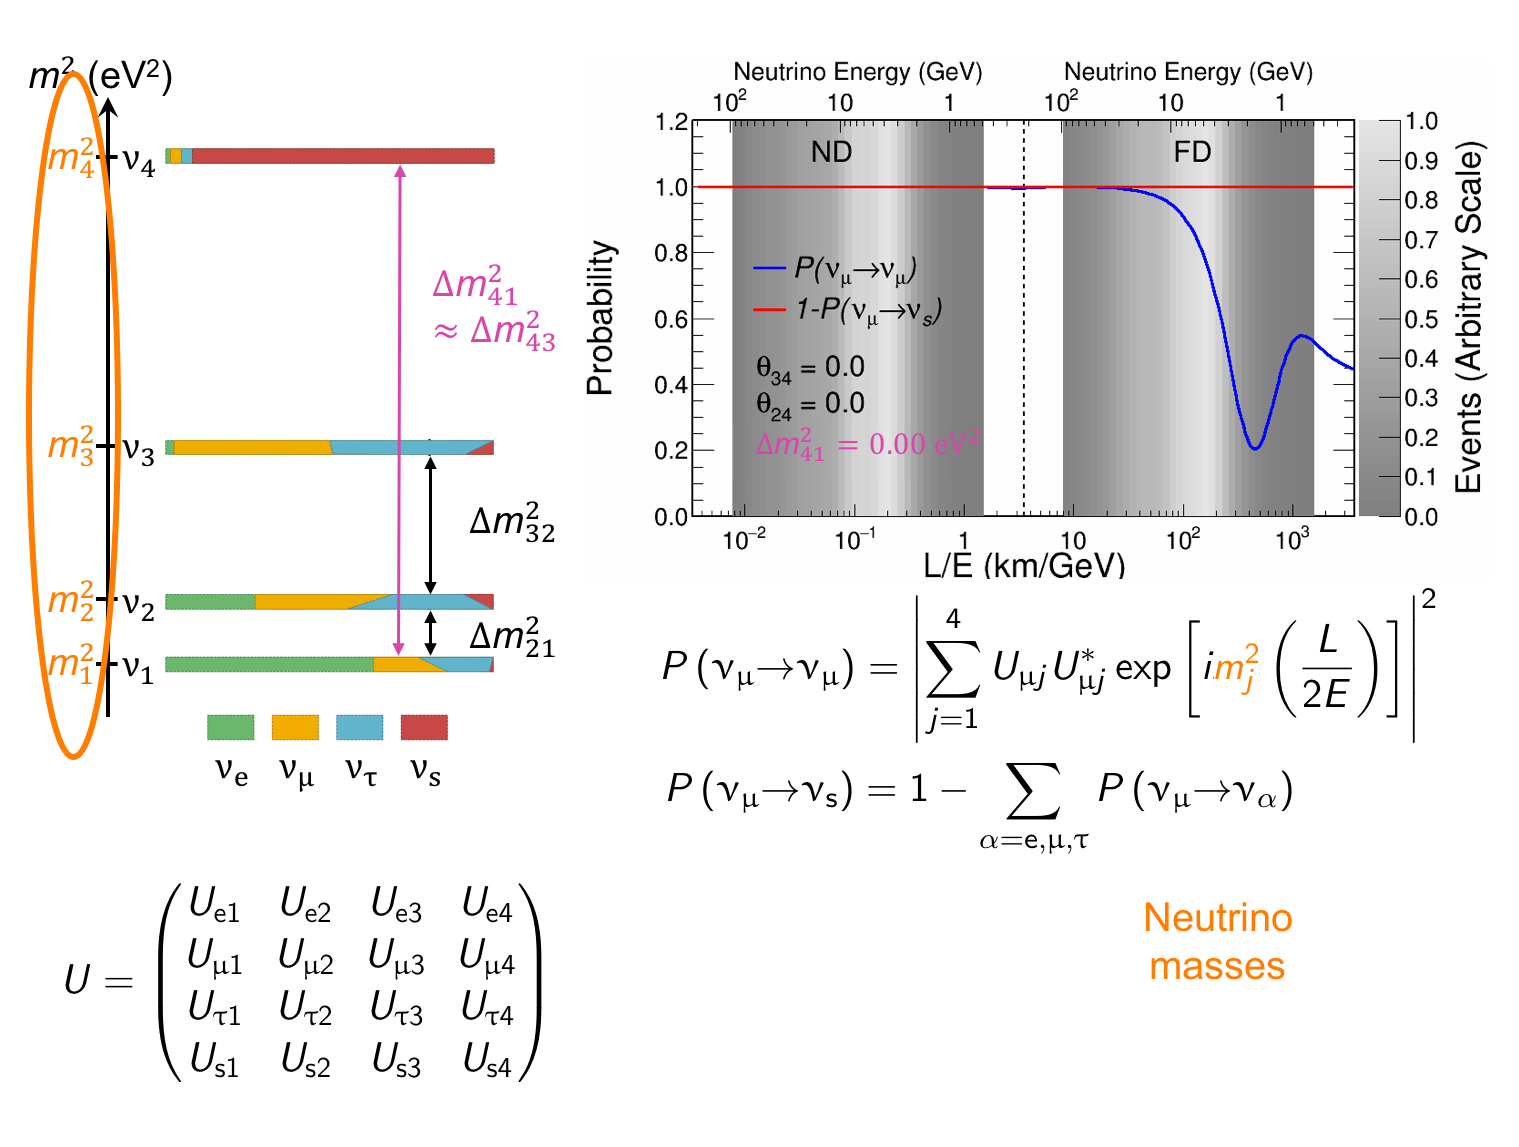
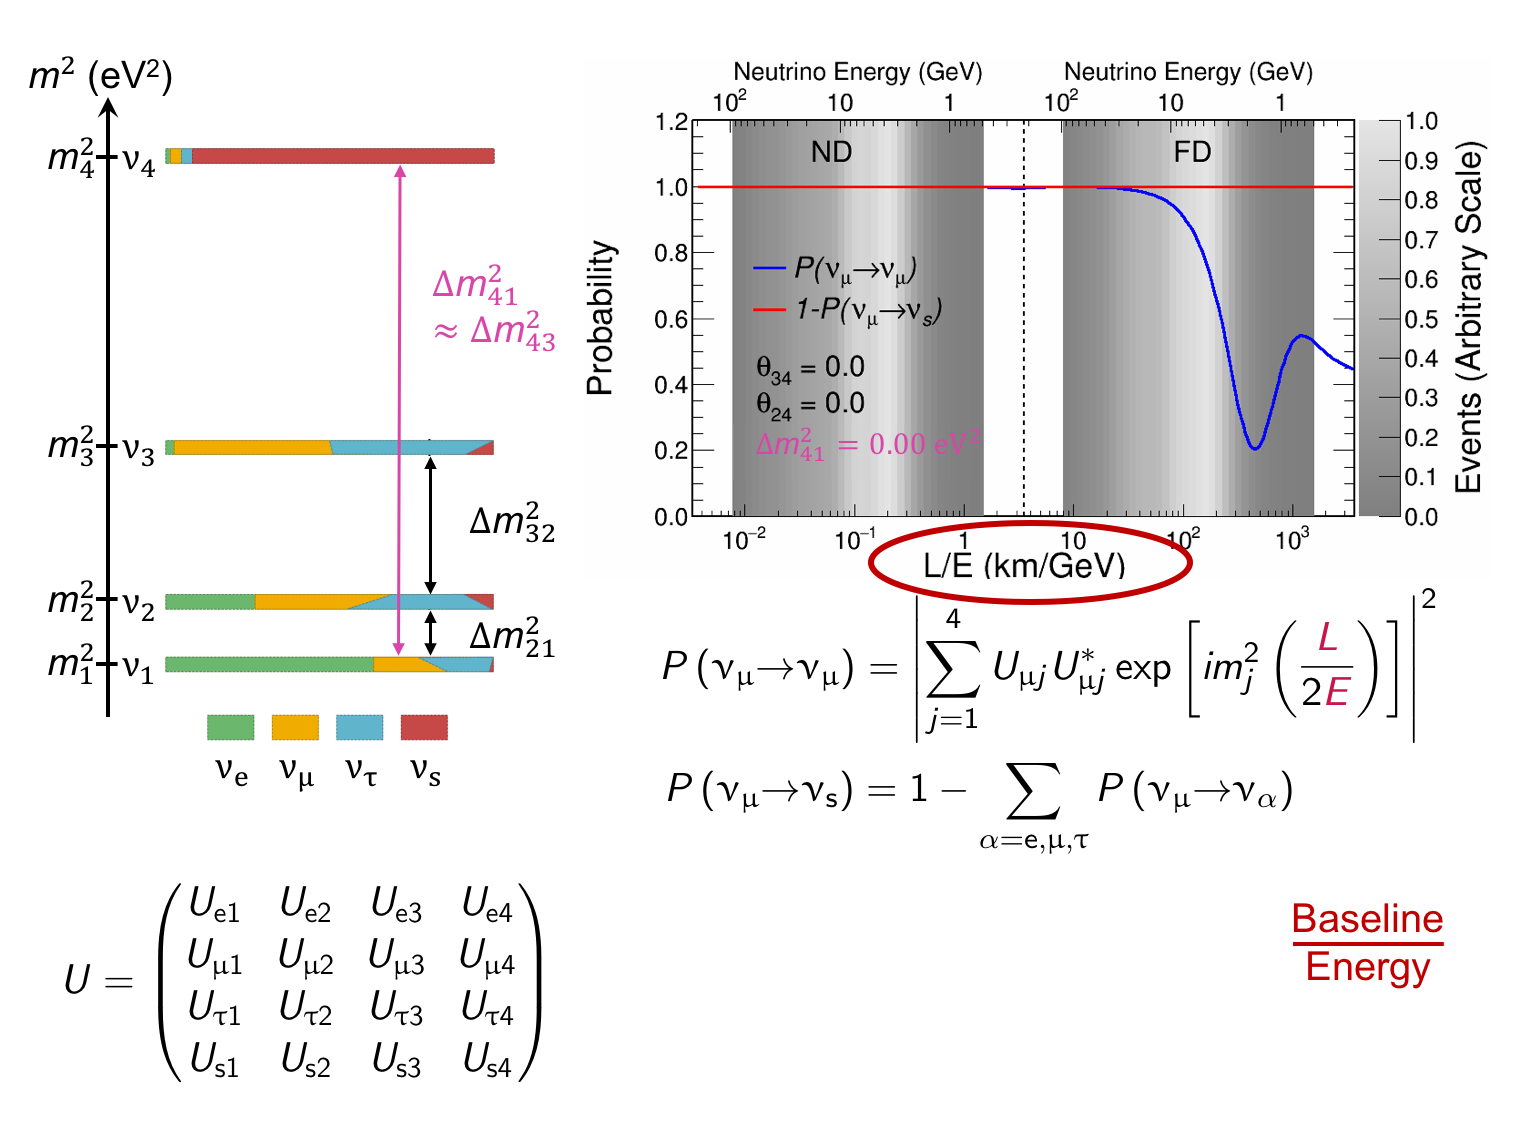
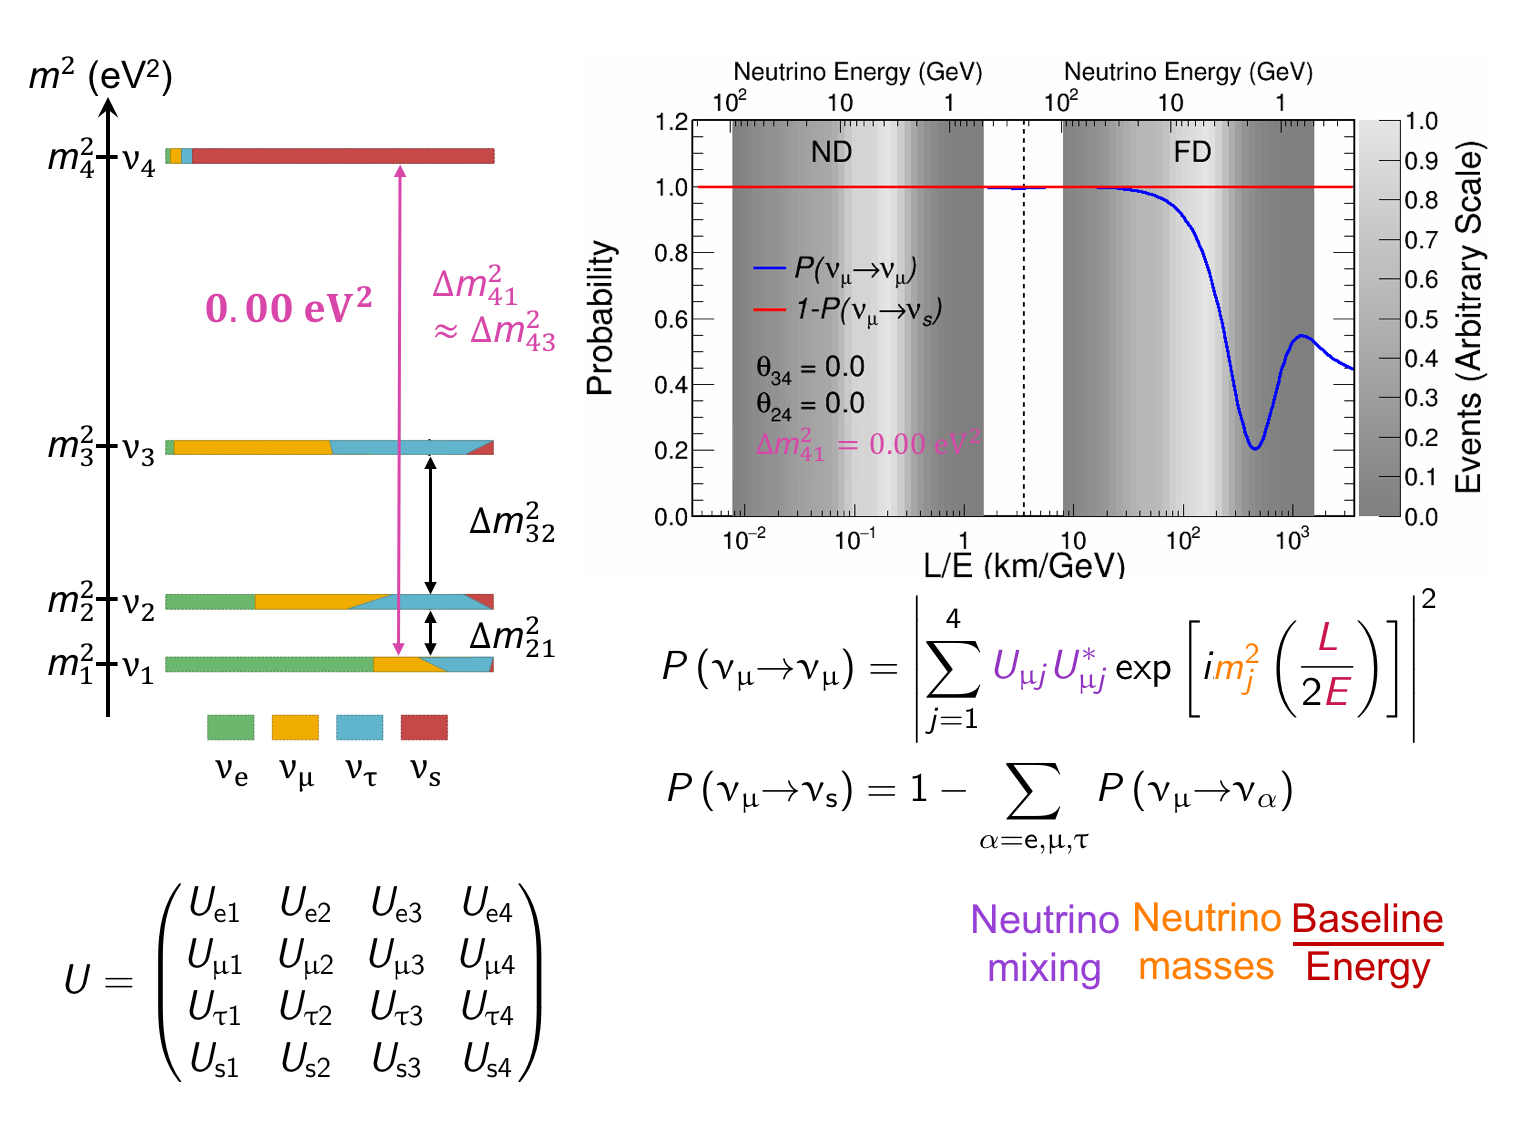
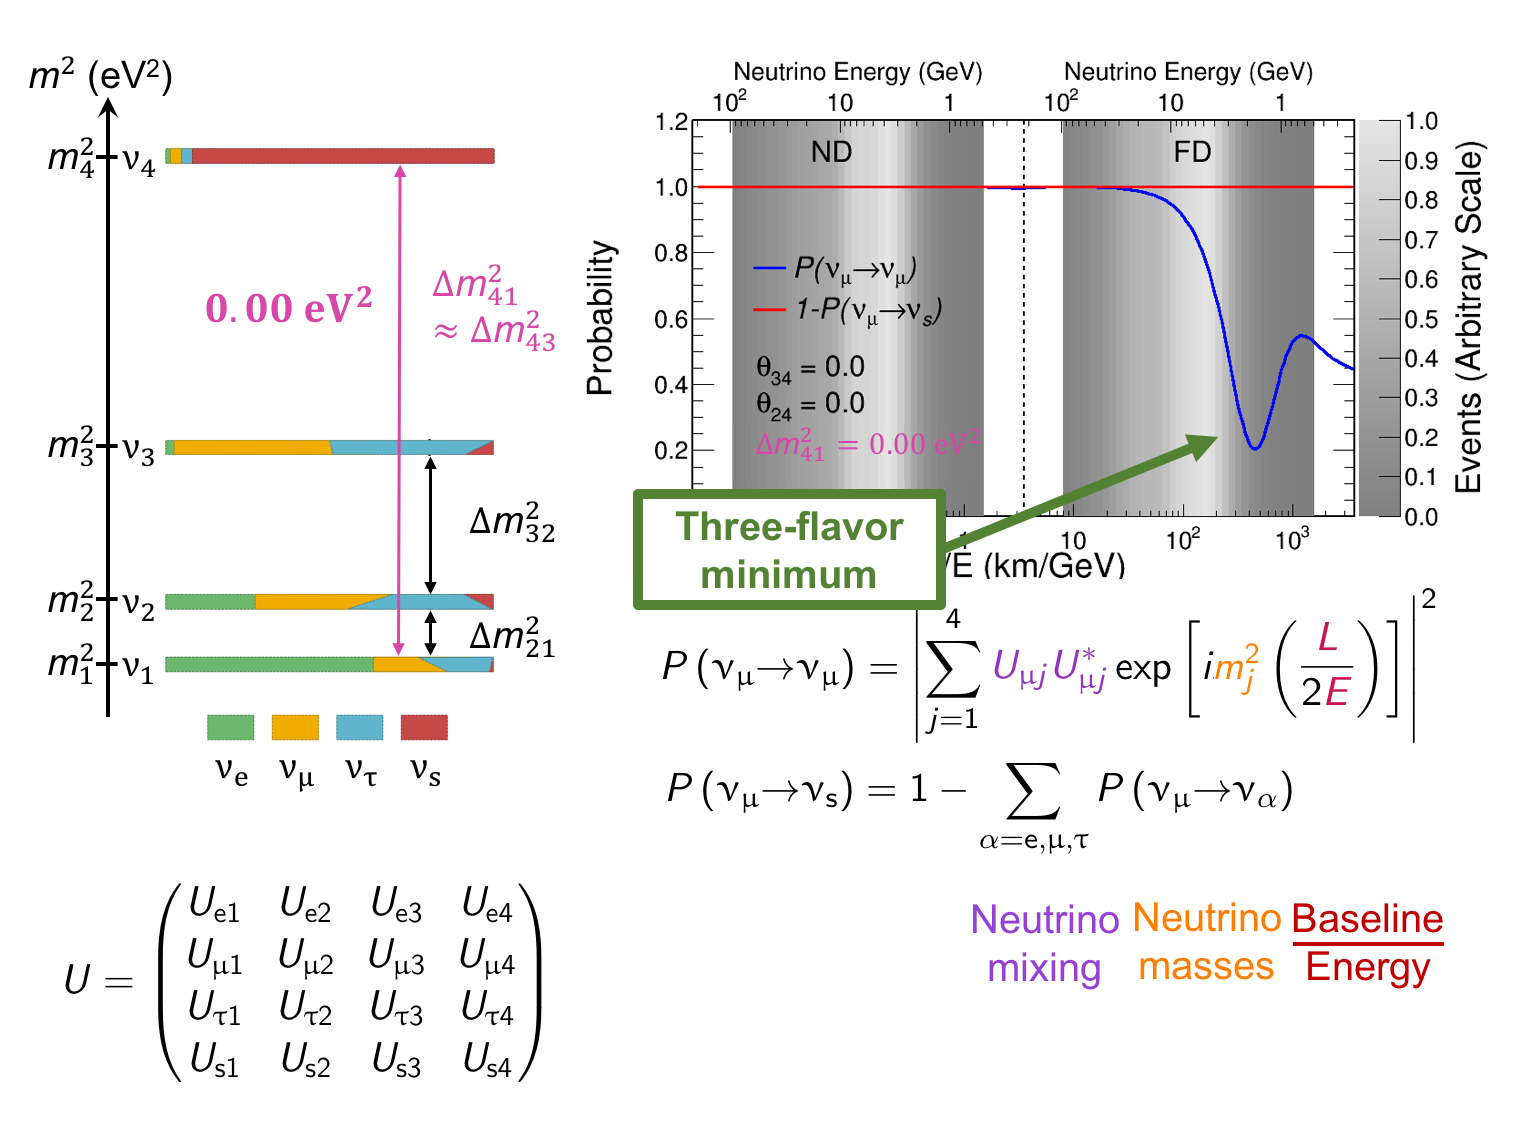
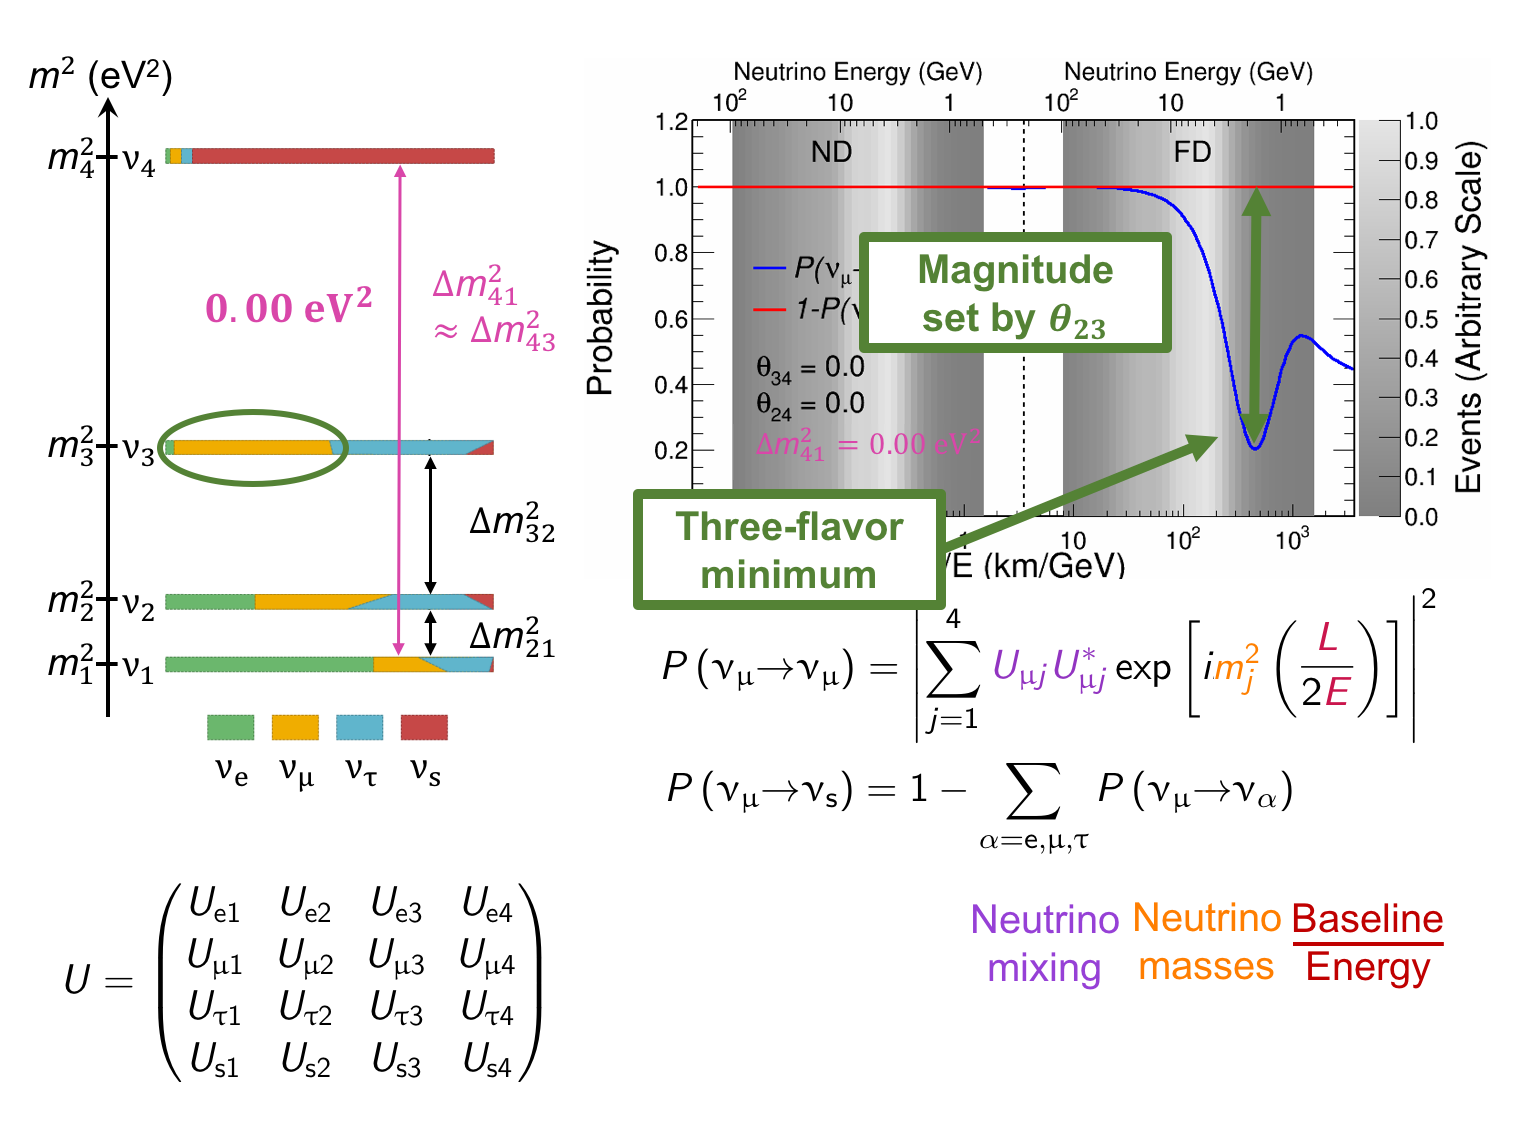
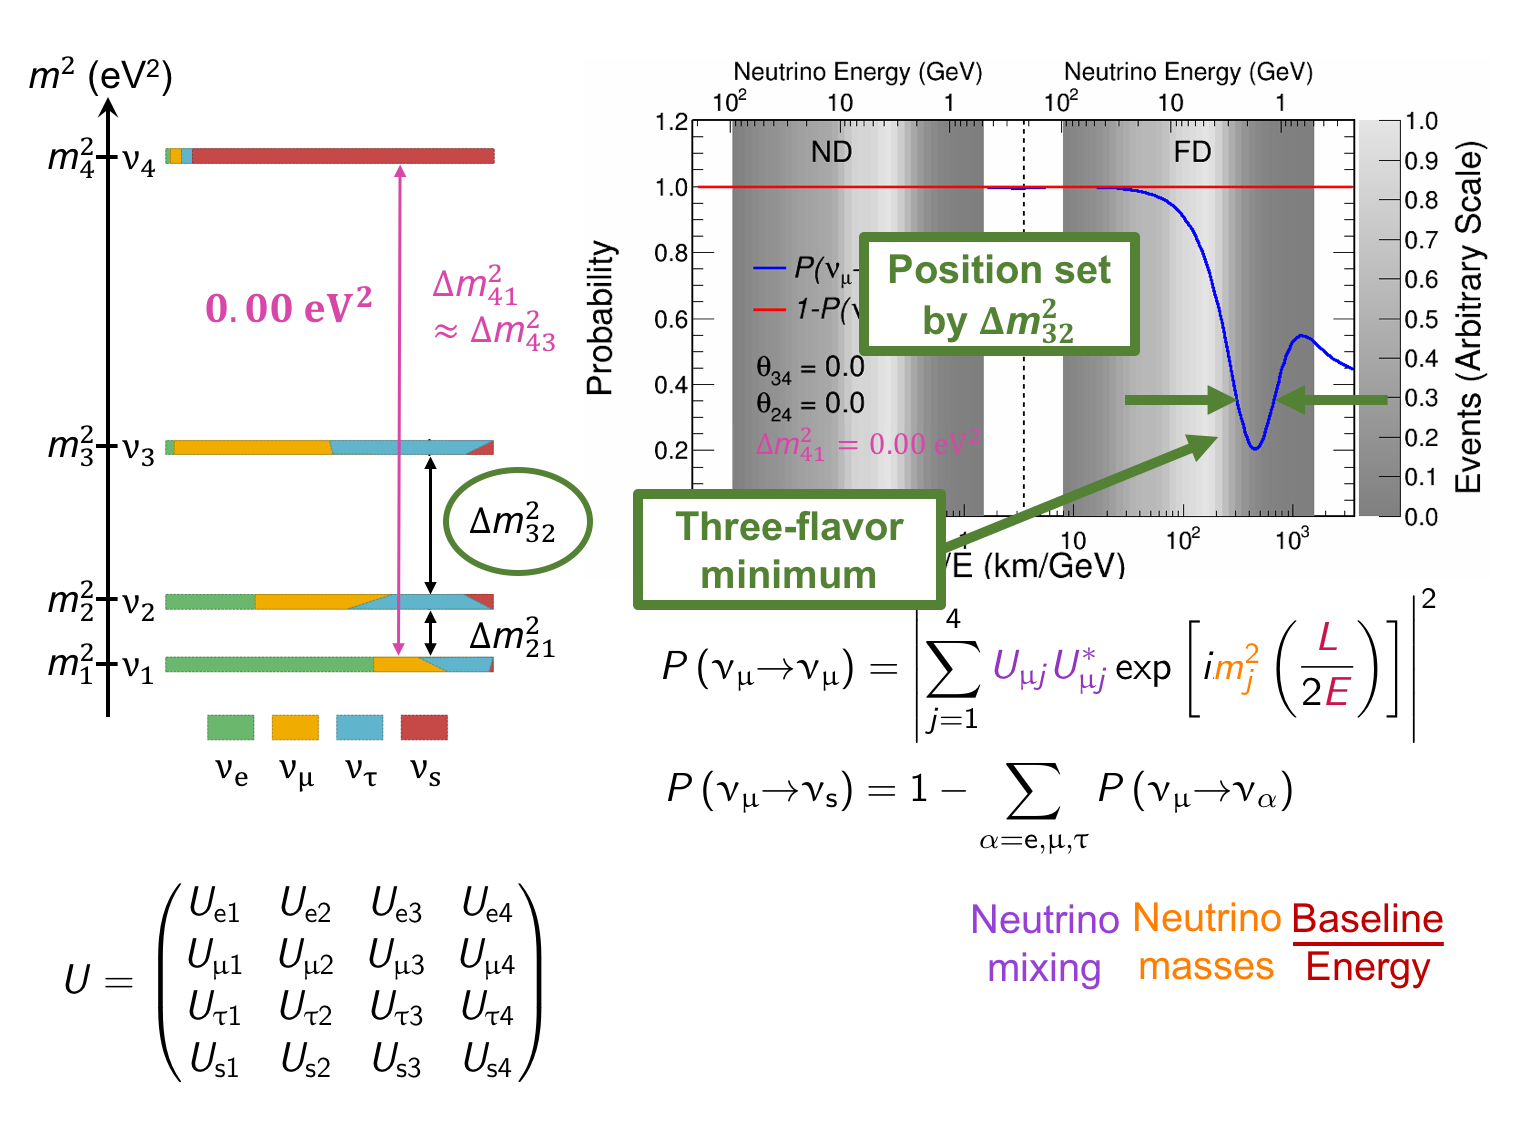
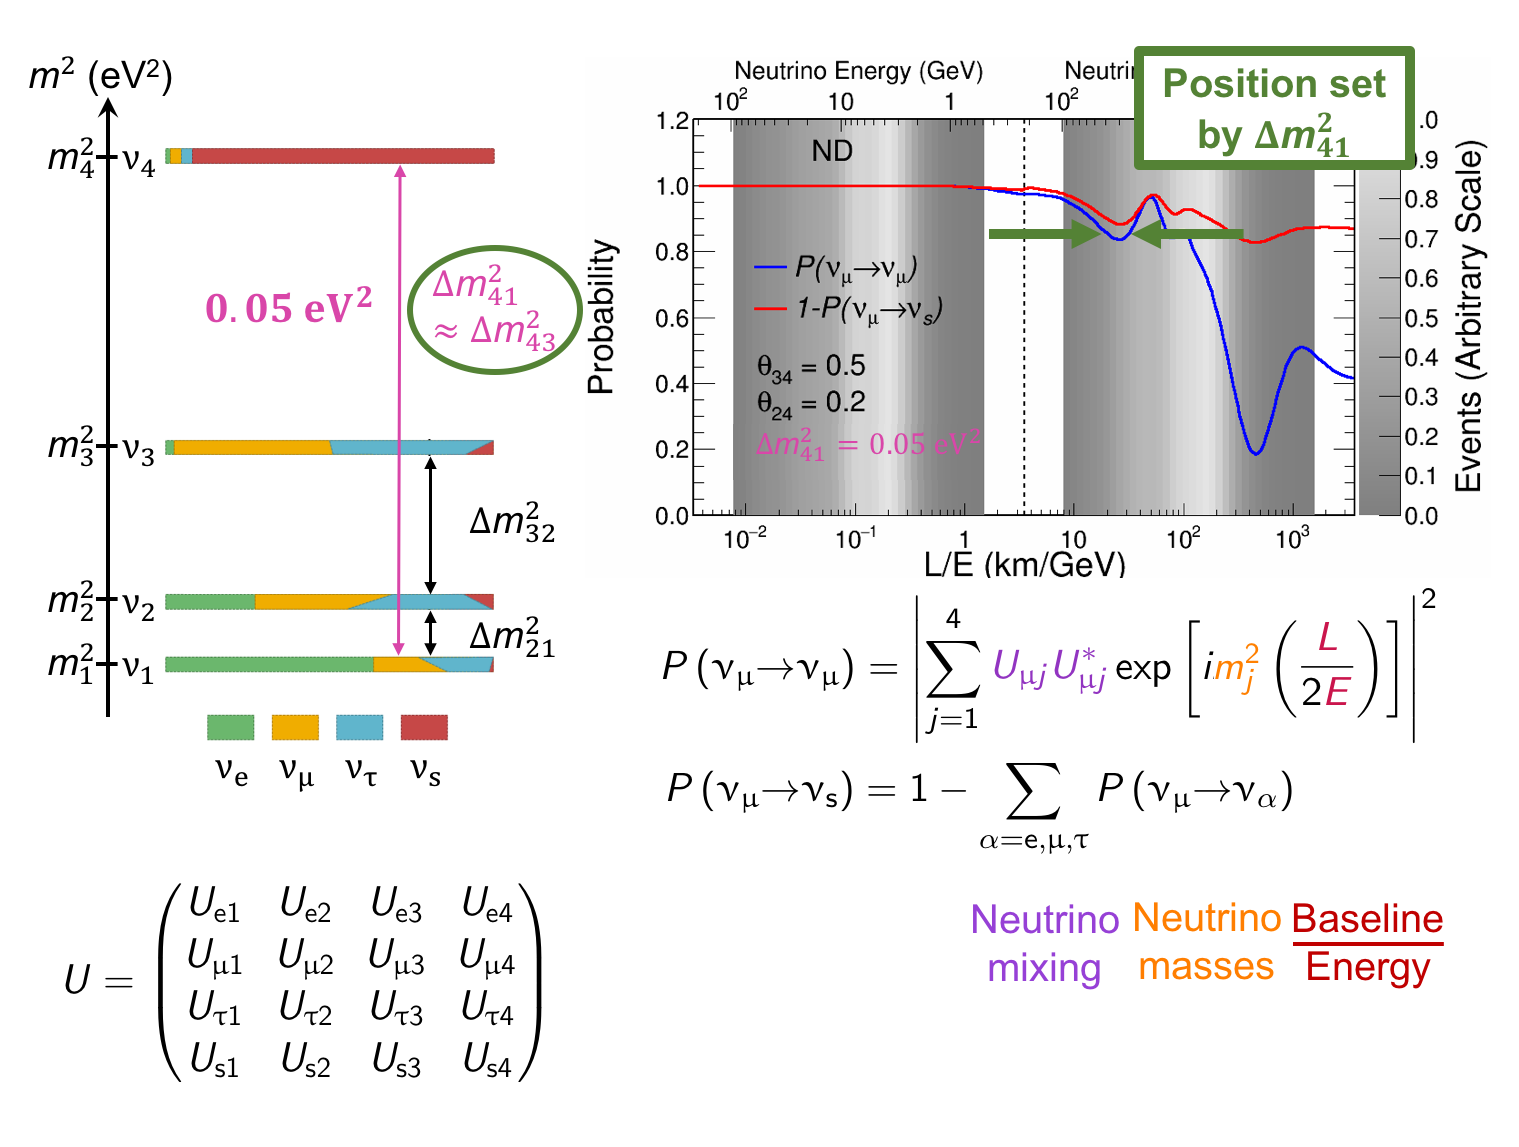
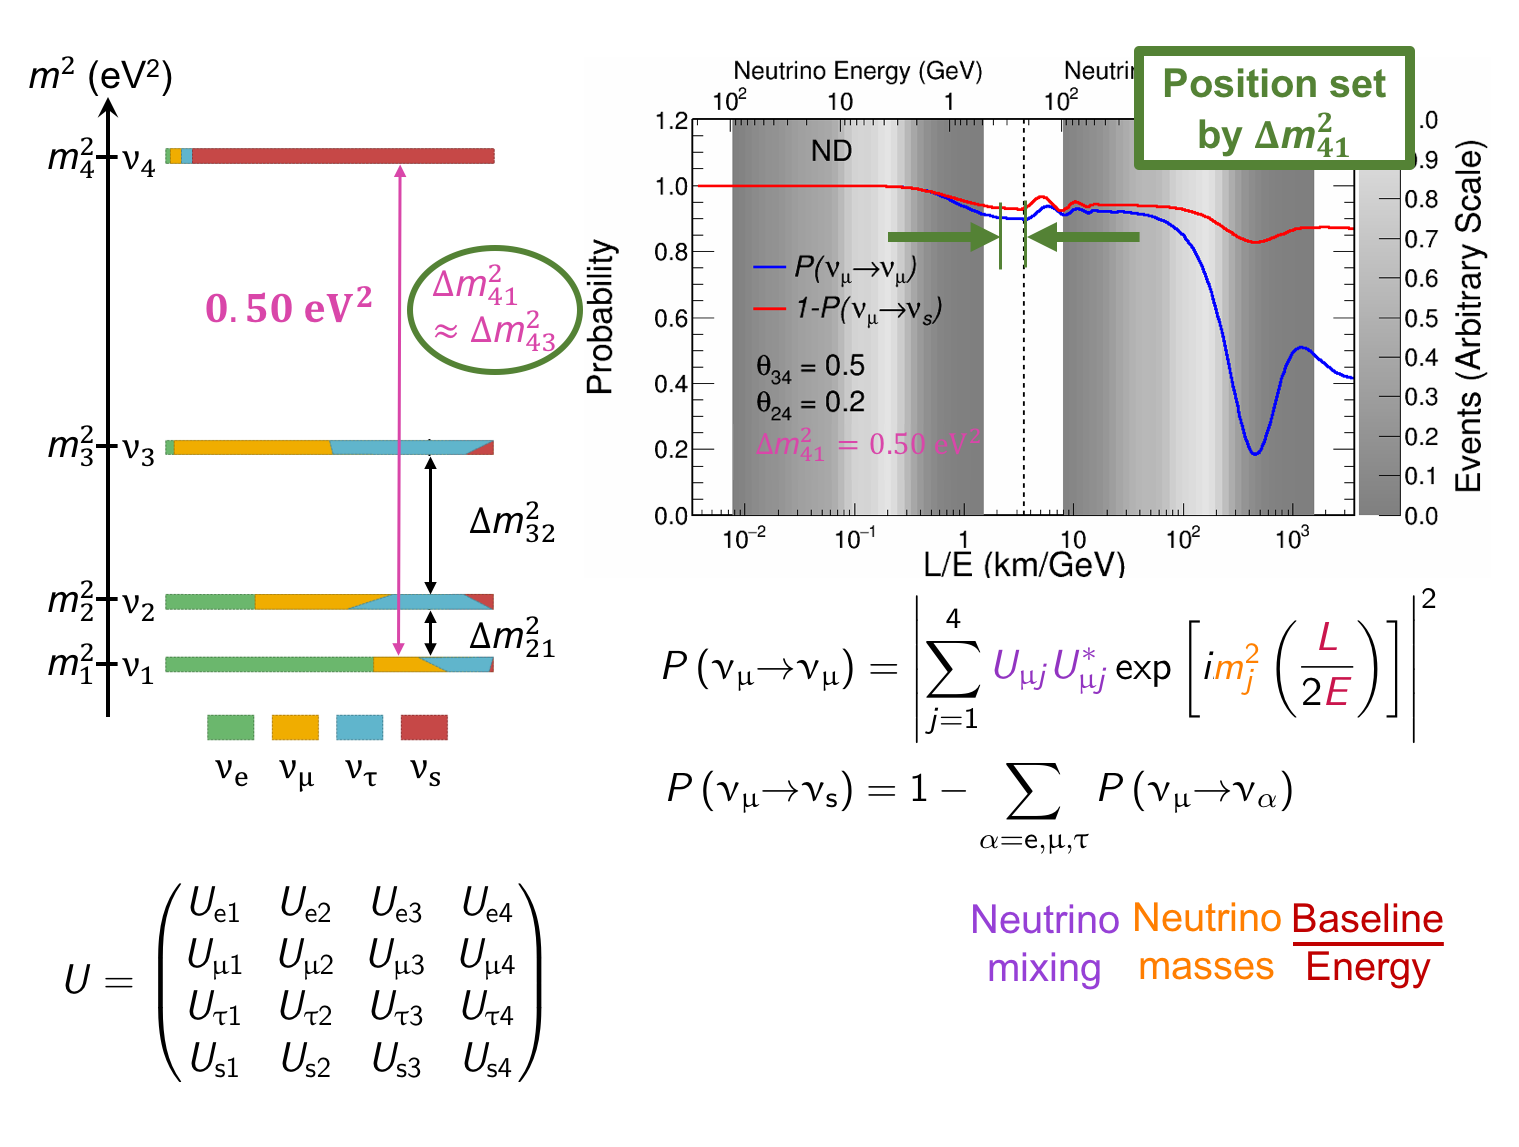
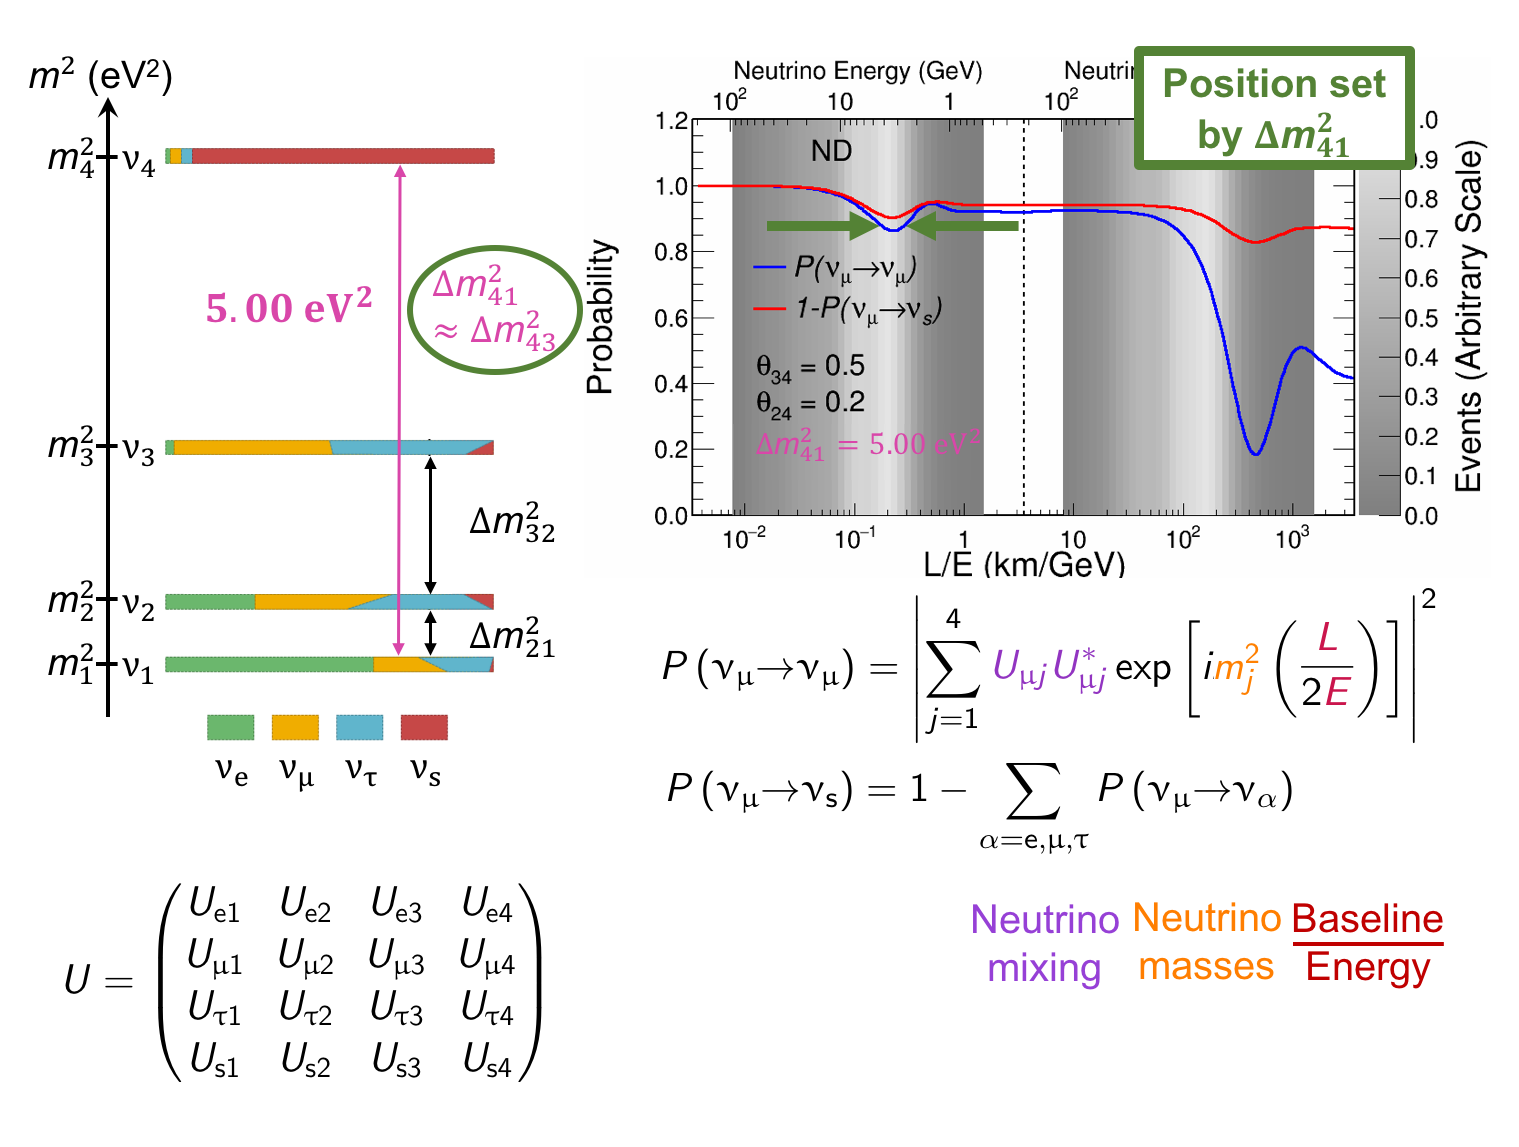
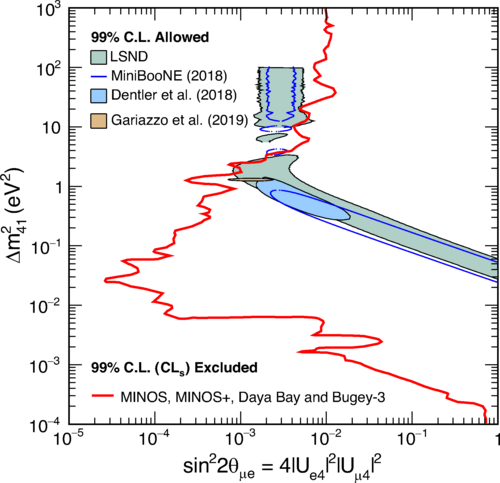
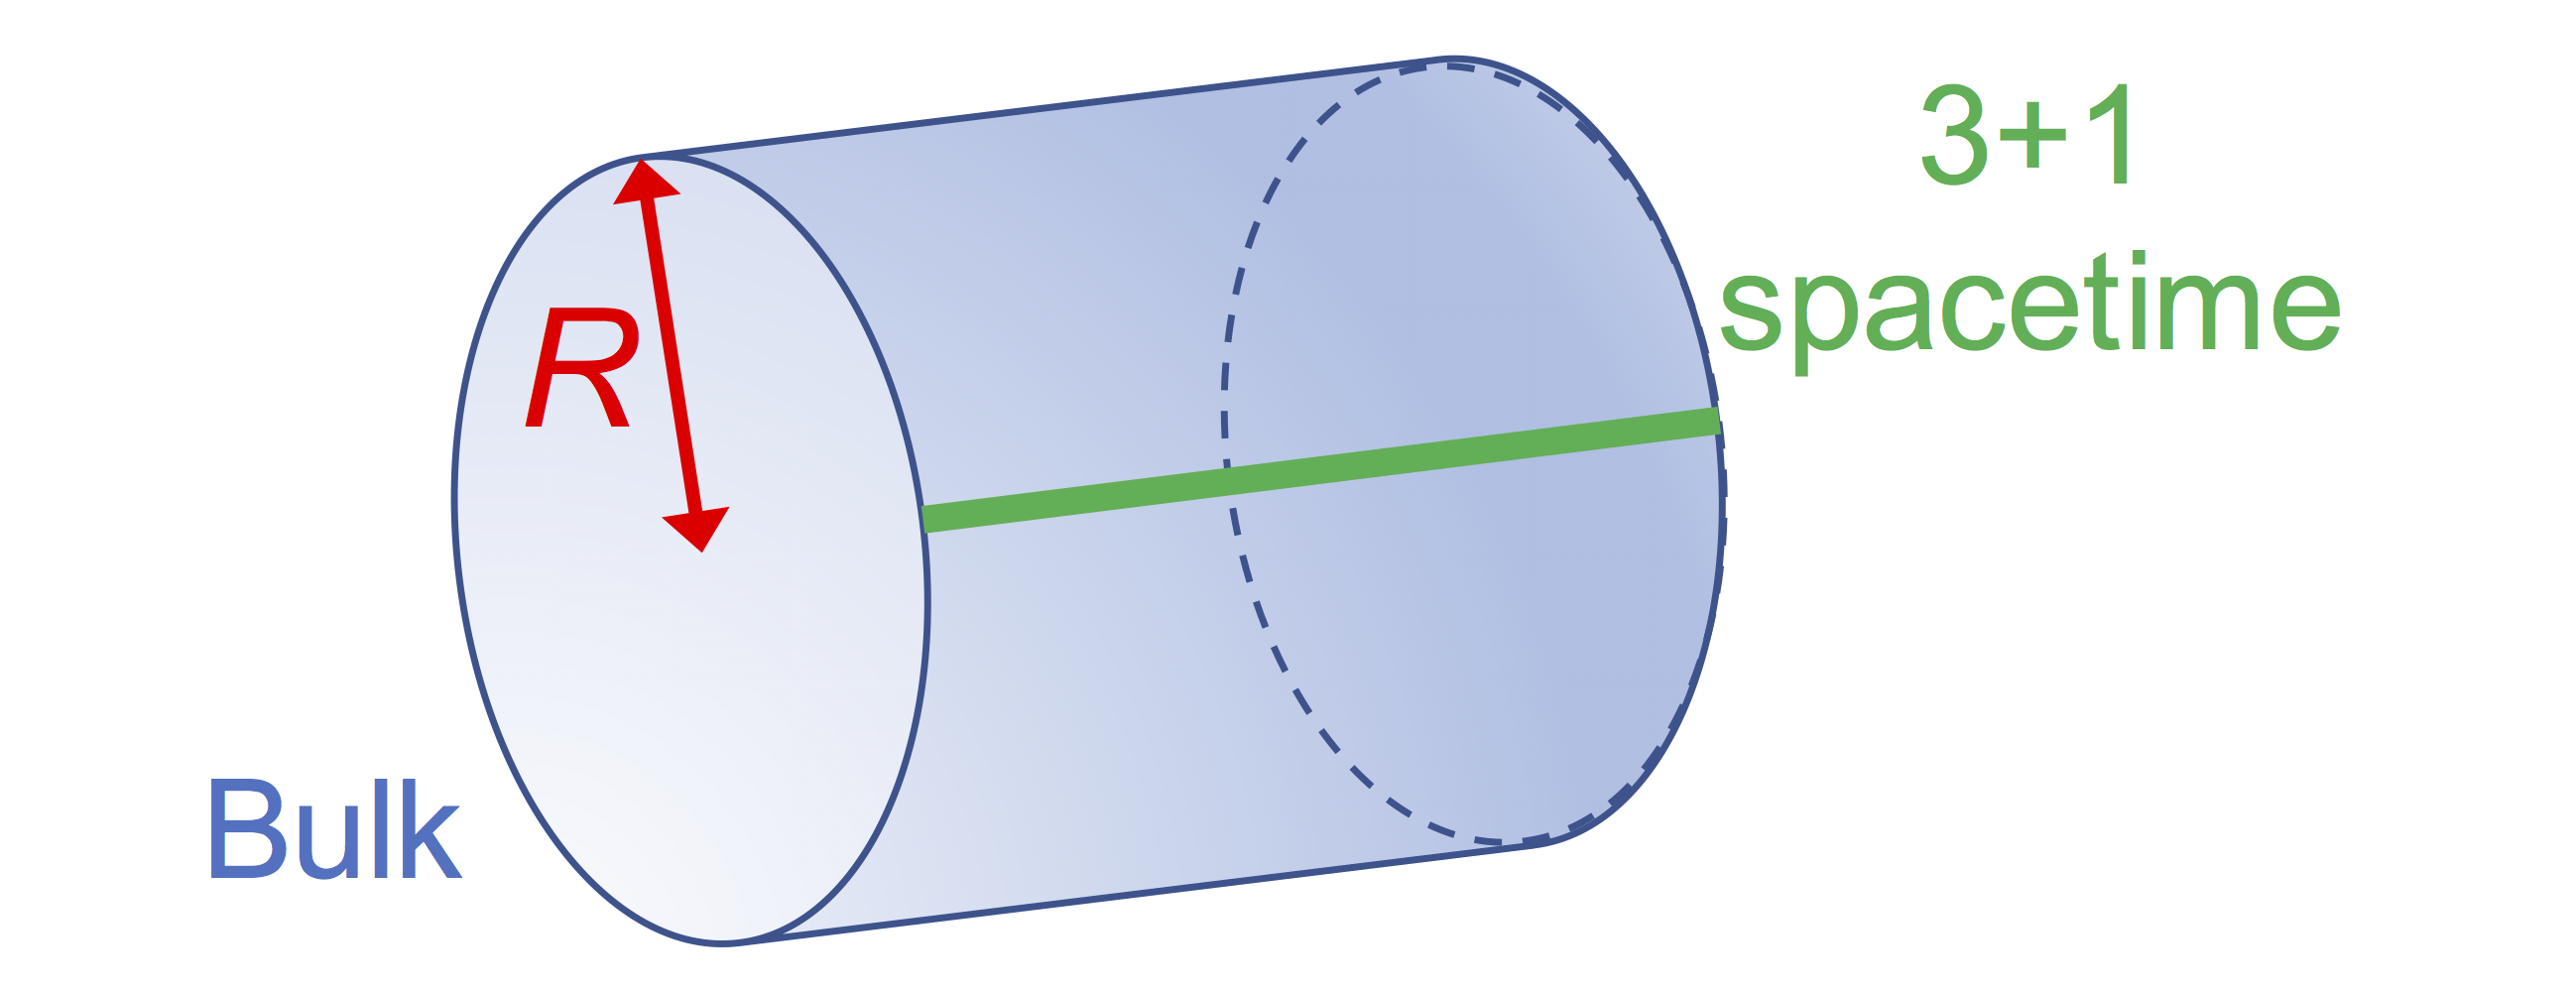
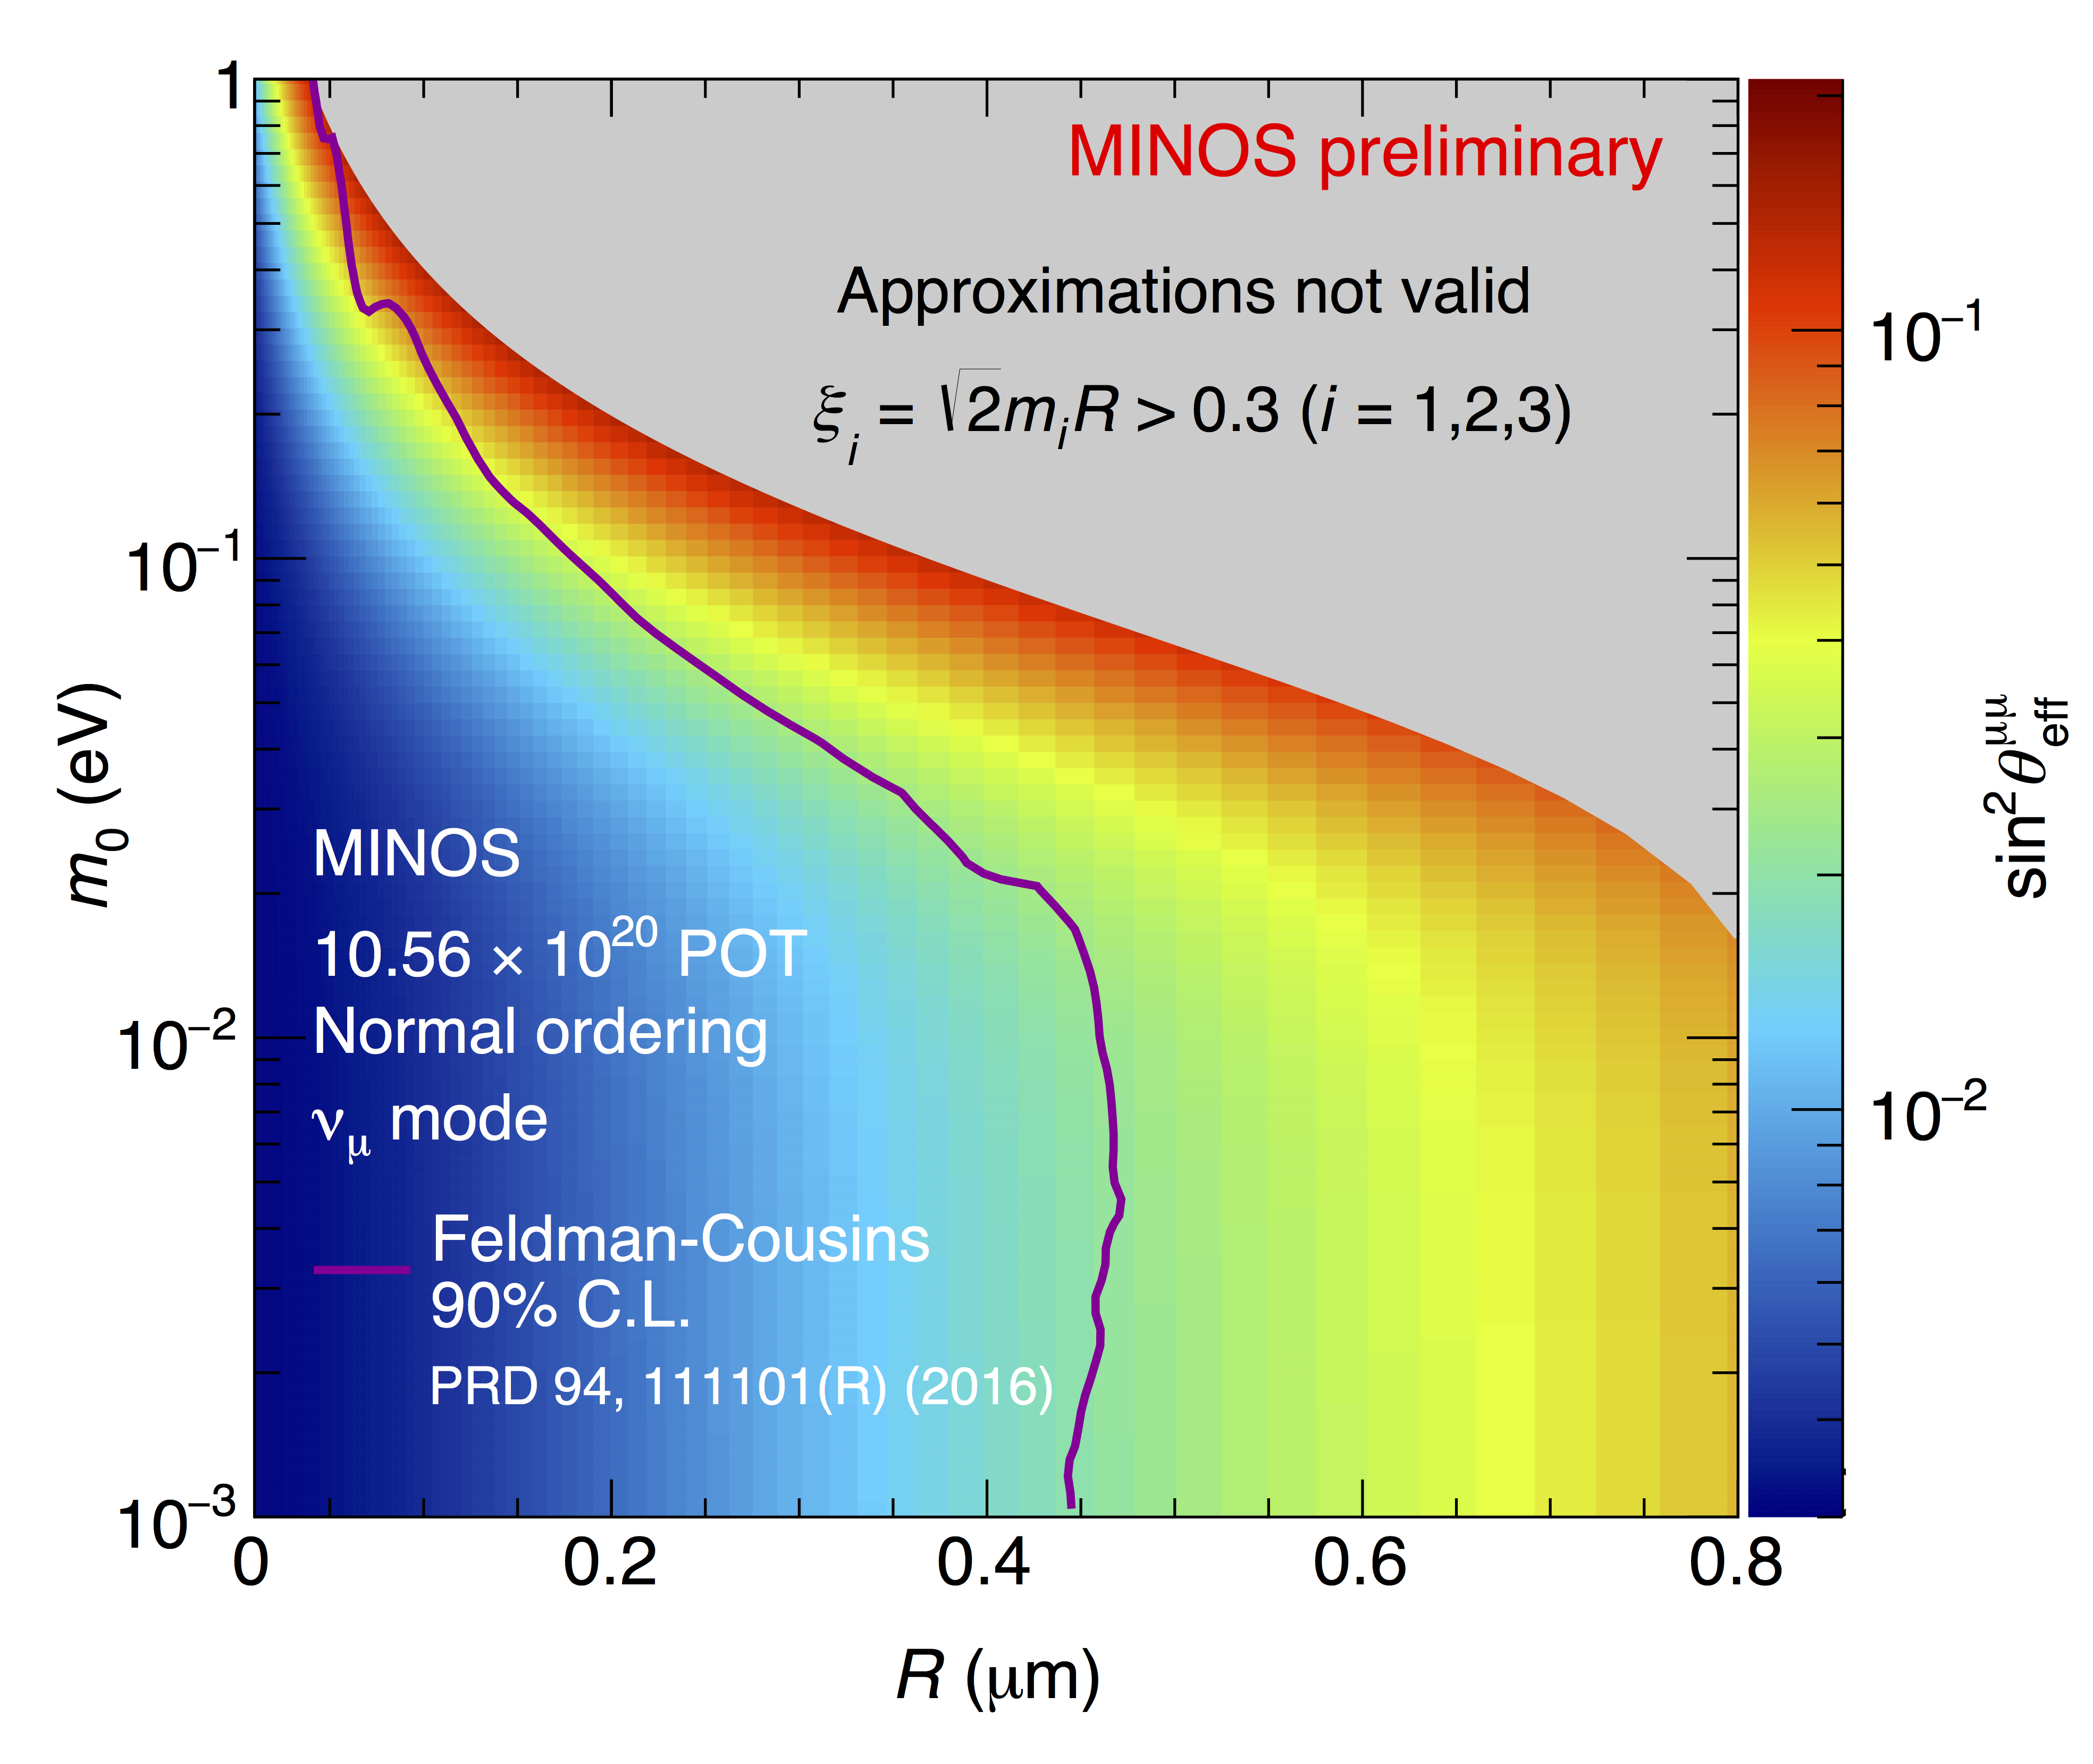
The MINOS experiment was operational between July 2003 and April 2012, detecting neutrinos from the NuMI neutrino beam with a peak neutrino energy of about 3GeV. MINOS was continued by MINOS+, which collected data between October 2013 and June 2016, using a NuMI neutrino beam with a peak neutrino energy shifted to about 7GeV. This shift to higher energies away from the three-flavor oscillation maximum around 1.5GeV increased the sensitivity to neutrino oscillation models beyond the three-flavor paradigm, including sterile neutrinos, large extra dimensions, and non-standard interactions.
The UTKL Research Group has been active on all fronts in the MINOS and MINOS+ Experiments, from detector RD, data acquisition, detector calibration, service work, and simulation, to data analysis. Currently we are analyzing the final MINOS+ data.
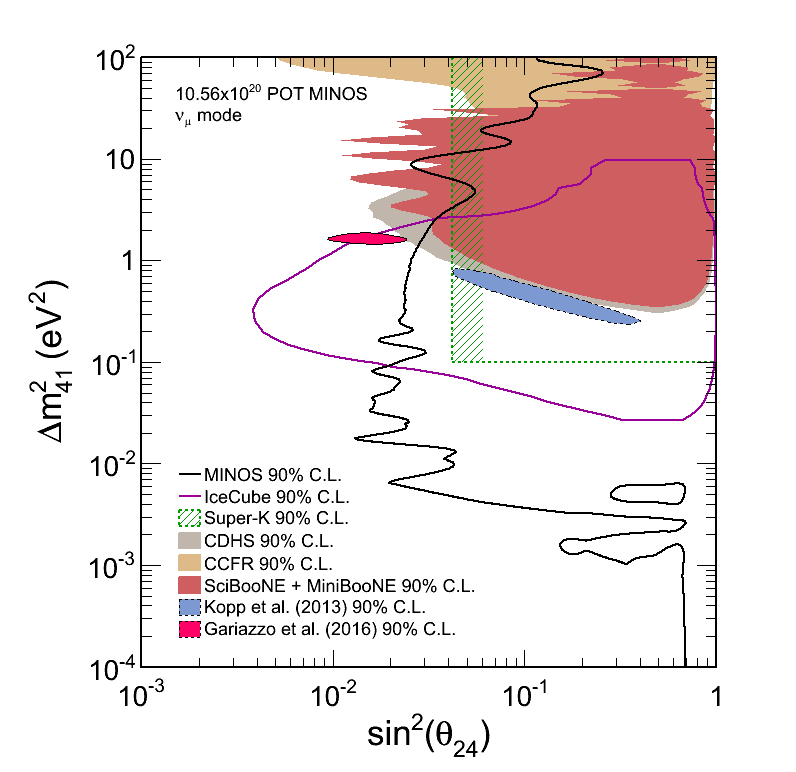
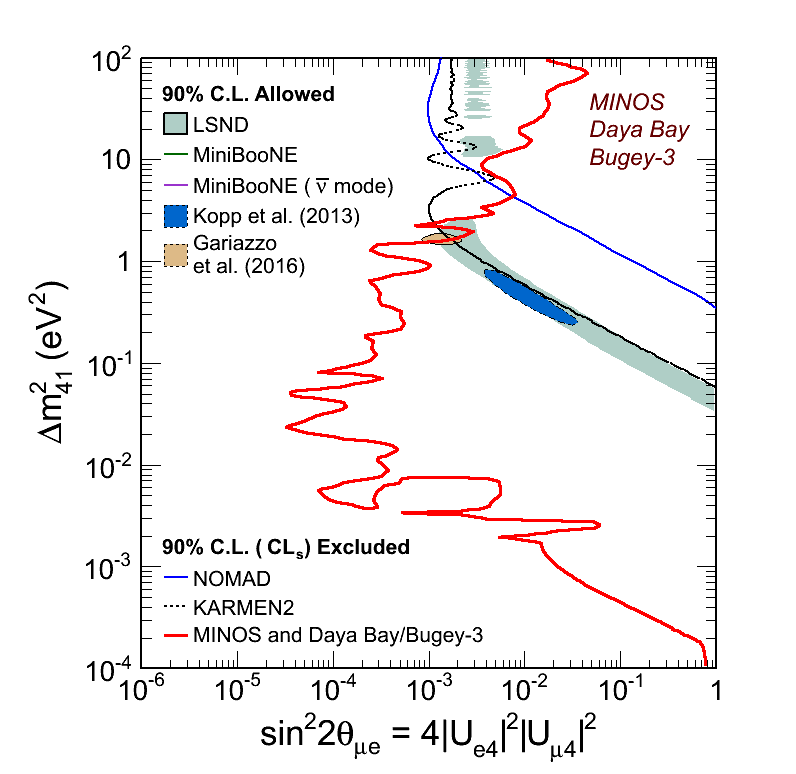
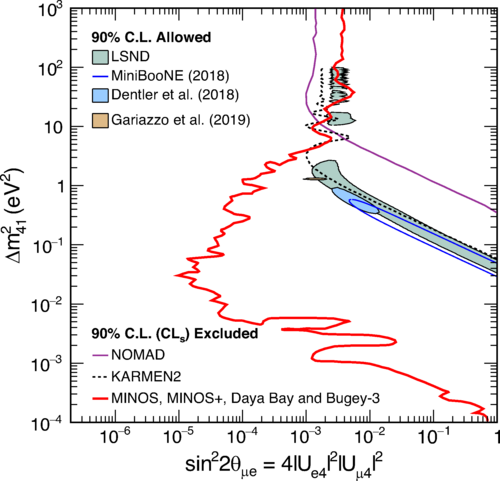
Find out more about the Three-Flavor, Four-Flavor, and Large Extra Dimensions searches in MINOS/MINOS+ below or visit the MINOS website.
The mixing of three neutrino states is experimentally well established by many experiments, including MINOS and MINOS+. This mixing is described by the Pontecorvo-Maki-Nakagawa-Sakata (PMNS) matrix which can be parameterized by three mixing angles , , , and a CP violating phase . The oscillation probabilities can be expressed such that they additionally depend on two mass-splittings and where , see Fig 1. MINOS and MINOS+ have made precision measurements (arXiv:2006.15208 [hep-ex]) of the three-flavor atmospheric oscillation parameters and , see Fig 4.
Figure 1: Measuring the atmospheric neutrino oscillation parameters and with MINOS. (Left) In the three-flavor paradigm, the muon neutrino disappearance along the MINOS FD baseline is determined by the mass-splitting and the mixing angle . (Right) The top figure compares the number of muon neutrino events measured by MINOS as a function of neutrino energy (black points) to the number of events predicted by the three-flavor model if there would be no oscillations (grey line) and the number of events predicted by the three-flavor model that agrees best with the MINOS data (red line). The bottom plot takes the ratio of the data and best prediction to the prediction of no oscillations, which is equivalent to the muon neutrino disappearance probability in the FD. The position of the minimum around 1.5GeV depends on the magnitude of , while the depth of the minimum is approximately set by .
Figure 2: Top: The reconstructed energy spectra for MINOS and MINOS+ events selected within the Far Detector fiducial volume for data (black points) and the best fit MC predictions for MINOS (red hatched histogram), MINOS+ (blue hatched histogram) and the sum (cyan line). The prediction at the FD with no oscillations is shown as the orange line. Bottom: The ratios of the data and the oscillated prediction to the no oscillation prediction for MINOS and MINOS+ combined.
We report the final measurement of the neutrino oscillation parameters and using all data from the MINOS and MINOS+ experiments. These data were collected using a total exposure of protons on target producing and beams and ktyr exposure to atmospheric neutrinos. The measurement of the disappearance of and the appearance of events between the Near and Far detectors yields and at C.L. for Normal (Inverted) Hierarchy.
Figure 3: 1D likelihood profiles as functions of and for each hierarchy.
Figure 4: The confidence limits on and for the normal mass hierarchy, comparing MINOS+, IceCube [PhysRevLett.120.071801], NOvA [PhysRevLett.123.151803], Super-K [PhysRevD.97.072001], and T2K [Nature 580, 339–344(2020)].
Neutrino oscillations between three neutrino flavors (electron, muon, and tau) are experimentally well established through measurements of solar, atmospheric, nuclear reactor, and accelerator beam neutrinos [Chin. Phys. C 38, 090001 (2014)] and are consistent with LEP results constraining the number of light neutrinos to three () through measurements of the invisible part of the boson decay width [J.PhysRep.2005.12.006]. The three-flavor paradigm is discussed in more detail in Three-Flavor Oscillations. There are, however, hints for the existence of an additional neutrino flavor. These include the anomalous electron antineutrino appearance in short-baseline muon antineutrino beams at LSND [PhysRevD.64.112007] and MiniBooNE [PhysRevLett.110.161801], which require a fourth neutrino state corresponding to a mass-splitting scale of about 1 eV. Given the LEP measurements, such a neutrino state would not couple through the Standard Model interactions and as such is called a sterile neutrino.
Mixing between the three active neutrinos and the sterile neutrino modifies the three-flavor oscillation probabilities, as illustrated in Fig. 1. The matrix describing mixing in the three-flavor paradigm can be extended to a matrix to accommodate the fourth neutrino state, as illustrated in Fig. 1. This introduces three additional mixing angles, , , and , as well as two additional charge-parity (CP) violating phases, and . Furthermore, three new mass-splittings, , and , enter the oscillation probabilities.
MINOS and MINOS+ are sensitive to , , and through muon neutrino disappearance. MINOS reported [PhysRevLett.117.151803] strong constraints on over a wide range of values, as shown in Fig. 2. A collaboration with the Daya-Bay reactor neutrino experiment [PhysRevLett.117.151801], which is sensitive to and through long-baseline electron antineutrino disappearance, allows to constrain the four-flavor model in terms of and , as shown in Fig. 2. This result can be directly compared to the LSND and MiniBooNE results.
Figure 2: The MINOS data 90 Feldman-Cousins corrected C.L. obtained using muon neutrino disappearance and searching for a deficit in NC events. The MINOS coverage is compared to other experimental results and to two global fits. (Right) The MINOS and Daya Bay/Bugey-3 combined 90 C.L. limit on compared to the LSND and MiniBooNE 90 C.L. allowed regions.
Recently, the combination of MINOS/MINOS+, Bugey-3 and Daya-Bay has been updated [PhysRevLett.125.071801] with new results from the Daya-Bay and MINOS+ experiments. Significantly improved constraints on the mixing angle are derived that constitute the most constraining limits to date over five orders of magnitude in the mass-squared splitting , excluding the C.L. sterile-neutrino parameter space allowed by the LSND and MiniBooNE observations at CLs for . Furthermore, the LSND and MiniBooNE C.L. allowed regions are excluded at CLs for . See below.
Figure 3: (Left) Comparison of the MINOS, MINOS+, Daya Bay, and Bugey-3 combined CLs limit on to the LSND and MiniBooNE C.L. allowed regions. Regions of parameter space to the right of the red contour are excluded. (Right) Comparison of the MINOS, MINOS+, Daya Bay, and Bugey-3 combined CLs limit on to the LSND and MiniBooNE C.L. allowed regions. The limit also excludes the C.L. region allowed by a fit to global data by Gariazzo et al. where MINOS, MINOS+, Daya Bay, and Bugey-3 are not included [JHEP06(2017)135, J.PhysLetB.2018.04.057], and the C.L. region allowed by a fit to all available appearance data by Dentler et al. [JHEP08(2018)010] updated with the 2018 MiniBooNE appearance results [PhysRevLett.121.221801].
Figure 1: (Left) Simplified picture of the circular extra dimension in the LED model. (Right) The Kaluza-Klein towers of active and sterile neutrinos for the LED scenario corresponding to an extra dimension radius m and a smallest active neutrino mass eV.
Figure 2: The muon neutrino disappearance probability along the MINOS FD baseline (with and without detector resolution effects) for the LED scenario corresponding to an extra dimension radius m and a smallest active neutrino mass eV.
Figure 3: The 90 C.L. data contour for the LED model, obtained using the Feldman-Cousins technique, based on POT MINOS data and assuming normal mass ordering.
NOvA or NuMI Off-Axis Appearance is a two-detector long baseline neutrino oscillation experiment, similar in spirit to MINOS/MINOS+. Fig. 1 illustrates the basic design of the NO\nuA detectors. Through observation of the oscillation of muon neutrinos to electron neutrinos in the NuMI beam, NOA aims to measure and the CP violating phase , and determine the neutrino mass ordering. In addition, through muon neutrino disappearance, NOA performs precision measurements of and . The NOA detectors consist of plastic PVC cells filled with liquid scintillator that are read out by WLS fibers coupled to avalanche photodiodes (APDs). A 330 metric-ton ND is located at Fermilab and a much larger 14 metric-kiloton FD in Ash River Minnesota, 810km from the NuMI target. Unlike the MINOS detectors, the NOA detectors are located off-axis of the NuMI beamline such that they are exposed to a large neutrino flux corresponding to an energy of 2GeV, the energy at which oscillations from muon neutrinos to electron neutrinos is expected to be at a maximum.
Figure 1: The basic design of the NOA detectors and readout system.
The UTKL Research Group has been involved in detector RD, service work, and simulation efforts on NOA and is increasing its contributions to data analysis.
Learn more about Optical Simulations for NOvA performed by the UTKL Research Group below or visit the NOvA website.
Figure 1: Display of a simulated event. This is example of one among 16 possible annihilation channels of antineutrons.
Figure 2: Energy characteristic of signal events compared to that of background. This is one of 9 discrimination variables used in the offline analysis to separate signal events from the background.
Figure 1: A dark box was constructed as a housing for the setup. A plane of seven 1.1m NOA cells was placed in the bottom container. This was filled with liquid scintillator to make sure the cells were fully immersed.
Figure 2: Number of photoelectrons dependencies on various hardware configurations from simulation. (a) Position of the fiber. The zero point and the maximum of the x-axis correspond to the cell center and PVC wall, respectively. (b) Scaling factor applied to the nominal PVC reflectivity. (c) Scintillator light yield. (d) Scaling factor applied to the nominal absorption length. (e) Fiber radius. (f) Fiber length.
The Deep Underground Neutrino Experiment (DUNE) will consist of two underground detectors exposed to the world’s most intense neutrino beam. Equipped with a far detector that consists of four 10 metric-kiloton liquid argon time projection chambers and a near detector at a distance of 1300 km, this international collaboration aims to enter the precision era of neutrino oscillations. Its primary objectives are measurements of the mixing angles and , the charge-parity (CP) violating phase and determine the neutrino mass ordering. In addition, DUNE is sensitive to neutrinos from core-collapsed supernovae and will conduct proton decay searches.
Learn more about the DUNE PhotoDetection Simulation efforts going on in our group below or visit the DUNE website.
Figure 1: Placeholder for hopefully Nice chamber images, if not then discard this.
Figure 2: Placeholder for hopefully Nice chamber images, if not then discard this.
Figure 1: A portion of DUNE’s Single Phase geometry TPC. APA = Anode Plane Assembly. CPA = Cathode Plane Assembly.
Figure 2: Dual Phase TPC design and working principle.